Telus 2010 Annual Report Download - page 164
Download and view the complete annual report
Please find page 164 of the 2010 Telus annual report below. You can navigate through the pages in the report by either clicking on the pages listed below, or by using the keyword search tool below to find specific information within the annual report.-
 1
1 -
2
-
3
-
4
-
5
-
6
-
7
-
8
-
9
-
10
-
11
-
12
-
13
-
14
-
15
-
16
-
17
-
18
-
19
-
20
-
21
-
22
-
23
-
24
-
25
-
26
-
27
-
28
-
29
-
30
-
31
-
32
-
33
-
34
-
35
-
36
-
37
-
38
-
39
-
40
-
41
-
42
-
43
-
44
-
45
-
46
-
47
-
48
-
49
-
50
-
51
-
52
-
53
-
54
-
55
-
56
-
57
-
58
-
59
-
60
-
61
-
62
-
63
-
64
-
65
-
66
-
67
-
68
-
69
-
70
-
71
-
72
-
73
-
74
-
75
-
76
-
77
-
78
-
79
-
80
-
81
-
82
-
83
-
84
-
85
-
86
-
87
-
88
-
89
-
90
-
91
-
92
-
93
-
94
-
95
-
96
-
97
-
98
-
99
-
100
-
101
-
102
-
103
-
104
-
105
-
106
-
107
-
108
-
109
-
110
-
111
-
112
-
113
-
114
-
115
-
116
-
117
-
118
-
119
-
120
-
121
-
122
-
123
-
124
-
125
-
126
-
127
-
128
-
129
-
130
-
131
-
132
-
133
-
134
-
135
-
136
-
137
-
138
-
139
-
140
-
141
-
142
-
143
-
144
-
145
-
146
-
147
-
148
-
149
-
150
-
151
-
152
-
153
-
 154
154 -
 155
155 -
 156
156 -
 157
157 -
 158
158 -
 159
159 -
 160
160 -
 161
161 -
 162
162 -
 163
163 -
 164
164 -
 165
165 -
 166
166 -
 167
167 -
 168
168 -
 169
169 -
 170
170 -
 171
171 -
 172
172 -
 173
173 -
 174
174 -
175
-
176
-
177
-
178
-
179
-
180
-
181
-
182
 |
 |

160 . TELUS 2010 annual report
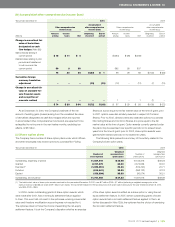
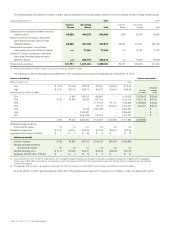
The following table reconciles the number of share options exercised and the associated number of Common Shares and Non-Voting Shares issued.
Years ended December 31 2010 2009
Common Non-Voting Common Non-Voting
Shares Shares Total Shares Shares To t a l
Shares issued or issuable pursuant to exercise
of share options 96,526 440,073 536,599 1,506 23,984 25,490
Impact of optionee choosing to settle share
option award exercises using net-cash
settlement feature 25,225 451,652 476,877 88,221 474,941 563,162
Shares issued pursuant to use of share
option award net-equity settlement feature n.a.(1) 77,061 77,061 n.a.(1) 15,162 15,162
Impact of Company choosing to settle share
option
award exercises using net-equity
settlement feature
n.a.(1) 238,814 238,814 n.a.(1) 15,946 15,946
Share options exercised 121,751 1,207,600 1,329,351 89,727 530,033 619,760
(1) Share option awards for Common Shares do not have a net-equity settlement feature.
The following is a life and exercise price stratification of the Company’s share options outstanding as at December 31, 2010.
Options outstanding(1) Options exercisable
Range of option prices To t a l
Low $ß 8.43 $ß14.93 $ß23.08 $ß34.81 $ß53.09 $ß 8.43 Weighted
High $ß10.75 $ß22.06 $ß33.14 $ß50.47 $ß64.64 $ß64.64 Number average
Year of expiry and number of shares of shares price
2 011 – 3,650 559,312 450,650 – 1,013,612 1,013,612 $ß29.08
2012 4,733 84,600 65,000 1,057,785 – 1,212,118 1,212,118 $ß37.00
2013 – – – 1,112,797 51,741 1,164,538 1,039,855 $ß43.52
2014 – – – 30,120 973,921 1,004,041 994,301 $ß56.45
2015 – – 19,475 2,321,328 – 2,340,803 – $ –
2016 – – 2,305,527 – – 2,305,527 – $ –
2017 – – 2,551,226 149,801 – 2,701,027 – $ –
4,733 88,250 5,500,540 5,122,481 1,025,662 11,741,666 4,259,886
Weighted average remaining
contractual life (years) 1.8 1.9 5.1 2.9 3.2 4.0
Weighted average price $ß10.10 $ß16.34 $ß30.85 $ß41.95 $ß56.70 $ß37.83
Aggregate intrinsic value(2) (millions) $ – $ 2 $ 68 $ 9 $ – $ 79
Options exercisable
Number of shares 4,733 88,250 624,312 2,544,159 998,432 4,259,886
Weighted average remaining
contractual life (years) 1.8 1.9 0.7 1.6 3.2 1.8
Weighted average price $ß10.10 $ß16.34 $ß24.41 $ß40.25 $ß56.66 $ß41.25
Aggregate intrinsic value(2) (millions) $ – $ 2 $ 12 $ 8 $ – $ 22
(1) As at December 31, 2010, 10,764,911 share options, with a weighted average remaining contractual life of 3.8 years, a weighted average price of $38.03 and an aggregate
intrinsic value of $72 million, are vested or were expected to vest; these amounts differ from the corresponding amounts for all share options outstanding due to an estimate
for expected forfeitures.
(2) The aggregate intrinsic value is calculated upon December 31, 2010, per share prices of $45.48 for Common Shares and $43.25 for Non-Voting Shares.
As at December 31, 2010, approximately 29 million Non-Voting Shares were reserved for issuance, from Treasury, under the share option plans.