Telus 2010 Annual Report Download - page 60
Download and view the complete annual report
Please find page 60 of the 2010 Telus annual report below. You can navigate through the pages in the report by either clicking on the pages listed below, or by using the keyword search tool below to find specific information within the annual report.-
 1
1 -
2
-
3
-
4
-
5
-
6
-
7
-
8
-
9
-
10
-
11
-
12
-
13
-
14
-
15
-
16
-
17
-
18
-
19
-
20
-
21
-
22
-
23
-
24
-
25
-
26
-
27
-
28
-
29
-
30
-
31
-
32
-
33
-
34
-
35
-
36
-
37
-
38
-
39
-
40
-
41
-
42
-
43
-
44
-
45
-
46
-
47
-
48
-
49
-
 50
50 -
 51
51 -
 52
52 -
 53
53 -
 54
54 -
 55
55 -
 56
56 -
 57
57 -
 58
58 -
 59
59 -
 60
60 -
 61
61 -
 62
62 -
 63
63 -
 64
64 -
 65
65 -
 66
66 -
 67
67 -
 68
68 -
 69
69 -
 70
70 -
71
-
72
-
73
-
74
-
75
-
76
-
77
-
78
-
79
-
80
-
81
-
82
-
83
-
84
-
85
-
86
-
87
-
88
-
89
-
90
-
91
-
92
-
93
-
94
-
95
-
96
-
97
-
98
-
99
-
100
-
101
-
102
-
103
-
104
-
105
-
106
-
107
-
108
-
109
-
110
-
111
-
112
-
113
-
114
-
115
-
116
-
117
-
118
-
119
-
120
-
121
-
122
-
123
-
124
-
125
-
126
-
127
-
128
-
129
-
130
-
131
-
132
-
133
-
134
-
135
-
136
-
137
-
138
-
139
-
140
-
141
-
142
-
143
-
144
-
145
-
146
-
147
-
148
-
149
-
150
-
151
-
152
-
153
-
154
-
155
-
156
-
157
-
158
-
159
-
160
-
161
-
162
-
163
-
164
-
165
-
166
-
167
-
168
-
169
-
170
-
171
-
172
-
173
-
174
-
175
-
176
-
177
-
178
-
179
-
180
-
181
-
182
 |
 |

56 . TELUS 2010 annual report
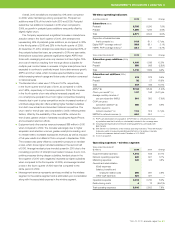
5.2 Summary of quarterly results and fourth quarter recap
($ in millions,
except per share amounts) 2010 Q4 2010 Q3 2010 Q2 2010 Q1 2009 Q4 2009 Q3 2009 Q2 2009 Q1
Operating revenues 2,551 2,455 2,398 2,375 2,443 2,411 2,377 2,375
Operations expense 1,672 1,501 1,460 1,429 1,577 1,456 1,451 1,441
Restructuring costs 32 17 19 6 77 32 53 28
EBITDA(1) 847 937 919 940 789 923 873 906
Depreciation 340 332 316 345 347 330 330 334
Amortization of
intangible assets 103 100 91 108 94 100 94 93
Operating income 404 505 512 487 348 493 449 479
Other expense 11 7 6 8 10 6 11 5
Financing costs 102 182 114 112 230 101 106 95
Income before income taxes 291 316 392 367 108 386 332 379
Income taxes (recovery) 64 69 96 99 (48) 106 88 57
Net income 227 247 296 268 156 280 244 322
Net income attributable to
Common Shares and
Non-Voting Shares 226 246 295 267 155 279 243 321
Income per Common Share
and Non-Voting Share
– basic 0.70 0.77 0.92 0.84 0.49 0.88 0.77 1.01
– diluted 0.70 0.76 0.92 0.84 0.49 0.87 0.77 1.01
Cash dividends declared
per Common Share
and Non-Voting Share 0.525 0.50 0.50 0.475 0.475 0.475 0.475 0.475
(1) EBITDA is a non-GAAP measure. See Section 11.1 Earnings before interest, taxes, depreciation and amortization (EBITDA).
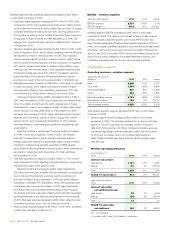
The wireline revenue trend reflects data revenue growth resulting
from the 85% increase in the TELUS TV subscriber base in 2010
as well as growth in enhanced data, Internet and managed workplace
revenues, moderated by ongoing declines in legacy basic data services.
The decline in wireline voice revenues is due to substitution to wireless
and Internet services, as well as competition from VoIP service providers
(including cable-TV competitors), resellers and facilities-based competi-
tors. See risk discussion in Section 10.1 Competition. Residential network
access line (NAL) net losses improved in the second half of 2010 when
compared to the prior year and the first half of 2010, positively impacted
by improved service bundle offers. Residential NAL losses had increased
year-over-year in the first half of 2010 as a result of promotional activity
from a primary regional cable-TV competitor for local telephony and
Internet services, and ongoing wireless substitution. Business NAL losses
in 2010 reflect increased competition in the small and medium business
market, conversion of voice lines to more efficient IP services, and cautious
business spending, as well as lower growth in Ontario and Quebec due
to the completion of some large enterprise deals, which also included
large private IP networks that are not counted as access lines.
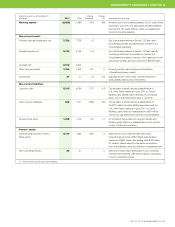
The trend in operations expense reflects higher wireless subscriber
acquisition and retention costs, expenses from Black’s Photo since
September 2009, and increased TELUS TV costs from the near-doubling
of the subscriber base, net of efficiencies realized from restructuring
initiatives.
Quarterly restructuring costs in 2010 were lower than reported in
2009 as management accelerated efficiency initiatives, primarily in the
wireline segment in that year.
The sequential decrease in quarterly depreciation expense in the
second quarter of 2010 included an adjustment for an increase in the
estimated useful life of TV set-top boxes (see Section 5.3 Consolidated
operations – Depreciation). The sequential increase in depreciation
Trends
The consolidated revenue trend reflects: (i) year-over-year growth
in wireless network revenues generated from an increasing subscriber
base and increased equipment and other revenues; and (ii) growth
in wireline data revenues including TELUS TV, being more than offset
by declining legacy wireline voice and other revenues.
Wireless network revenue increased by 8.8% year-over-year in the
fourth quarter of 2010 reflecting a general trend of growing data ARPU,
which continued in the quarter with a year-over-year growth of 27%,
partly offset by declining voice ARPU of 5.2% (as discussed further in
Section 5.4). Data ARPU growth is due to increased adoption of data
plans driven by increased smartphone adoption. The growing demand
for wireless data may challenge network and spectrum capacity in the
future (see Section 10.2 Technology). Wireless equipment and other
revenues increased by 13% year-over-year in the fourth quarter of 2010,
primarily from higher acquisition and retention volumes that were
driven by a higher smartphone mix.
The entry of new wireless competitors, as well as the launch of a
new wireless incumbent flanker brand and a competitor brand re-launch,
could disrupt usual seasonal patterns for wireless subscriber additions
in the future. Historically, there has been significant fourth quarter sea-
sonality with respect to higher wireless subscriber additions, related
acquisition costs and equipment sales, and higher retention costs due
to contract renewals, resulting in lower fourth quarter wireless EBITDA.
The third quarter has become more significant in terms of subscriber
additions and associated acquisition costs in recent years as a result
of back-to-school offers, while subscriber additions have typically
been lowest in the first quarter. In addition, wireless ARPU has generally
risen sequentially in the second and third quarters, and declined
sequentially in the fourth and first quarters.