Telus 2010 Annual Report Download - page 46
Download and view the complete annual report
Please find page 46 of the 2010 Telus annual report below. You can navigate through the pages in the report by either clicking on the pages listed below, or by using the keyword search tool below to find specific information within the annual report.-
 1
1 -
2
-
3
-
4
-
5
-
6
-
7
-
8
-
9
-
10
-
11
-
12
-
13
-
14
-
15
-
16
-
17
-
18
-
19
-
20
-
21
-
22
-
23
-
24
-
25
-
26
-
27
-
28
-
29
-
30
-
31
-
32
-
33
-
34
-
35
-
 36
36 -
 37
37 -
 38
38 -
 39
39 -
 40
40 -
 41
41 -
 42
42 -
 43
43 -
 44
44 -
 45
45 -
 46
46 -
 47
47 -
 48
48 -
 49
49 -
 50
50 -
 51
51 -
 52
52 -
 53
53 -
 54
54 -
 55
55 -
 56
56 -
57
-
58
-
59
-
60
-
61
-
62
-
63
-
64
-
65
-
66
-
67
-
68
-
69
-
70
-
71
-
72
-
73
-
74
-
75
-
76
-
77
-
78
-
79
-
80
-
81
-
82
-
83
-
84
-
85
-
86
-
87
-
88
-
89
-
90
-
91
-
92
-
93
-
94
-
95
-
96
-
97
-
98
-
99
-
100
-
101
-
102
-
103
-
104
-
105
-
106
-
107
-
108
-
109
-
110
-
111
-
112
-
113
-
114
-
115
-
116
-
117
-
118
-
119
-
120
-
121
-
122
-
123
-
124
-
125
-
126
-
127
-
128
-
129
-
130
-
131
-
132
-
133
-
134
-
135
-
136
-
137
-
138
-
139
-
140
-
141
-
142
-
143
-
144
-
145
-
146
-
147
-
148
-
149
-
150
-
151
-
152
-
153
-
154
-
155
-
156
-
157
-
158
-
159
-
160
-
161
-
162
-
163
-
164
-
165
-
166
-
167
-
168
-
169
-
170
-
171
-
172
-
173
-
174
-
175
-
176
-
177
-
178
-
179
-
180
-
181
-
182
 |
 |

42 . TELUS 2010 annual report
expected, reflecting a shortfall from wireline sales growth and ongoing
erosion in legacy voice services. Achievement of the consolidated
EBITDA and earnings targets reflects strong wireless performance and
the realization of benefits from strategic investments in broadband
networks and operating efficiency initiatives.
TELUS provided revised public guidance on August 6, 2010, to reflect
lower expected consolidated and wireline revenue. On November 5,
the Company further revised public guidance for an expected increase
in the lower end of the range for consolidated EBITDA and earnings
per share, as well as higher endpoints for the wireless EBITDA range.
The guidance revisions were achieved.
The following scorecard compares TELUS’ fiscal 2010 performance
to its original targets and presents targets for 2011. As a result of the
convergence of Canadian GAAP with IFRS-IASB (abbreviated as IFRS),
and TELUS’ changeover to IFRS on January 1, 2011, targets for 2011
are according to IFRS. Unaudited pro forma IFRS 2010 comparative
results are provided for reference. Further discussion of the expected
effects of the changeover to IFRS is provided in Section 8.2 Accounting
policy developments.
Targets for 2011 were announced on December 14, 2010. These
targets and pro forma comparative results for 2010 are fully qualified by
the Caution regarding forward-looking statements at the beginning of
the MD&A, as well as the discussion in Section 8.2. Additional information
on expectations and assumptions for 2011 are provided in Section 1.5
Financial and operating targets for 2011, Section 1.6 TELUS segment
targets, and Section 9: General outlook.
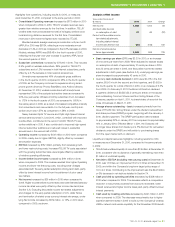
.Cash used by financing activities increased by $124 million in 2010
when compared to 2009, mainly due to refinancing activities and
debt reduction.
In 2010, the Company extended the average term to maturity on
its long-term debt to 5.7 years from five years at December 31, 2009,
through two key financing activities: (i) a $1 billion 10-year, 5.05%
Note issue in July; and (ii) use of the Note proceeds in September
to early redeem U.S.$607 million, or approximately 45%, of its then
outstanding U.S. dollar 8% Notes due June 1, 2011, and terminate
associated cross currency interest rate swaps. The U.S. dollar debt
has an effective yield of approximately 8.5%. This partial redemption
and a similar Note issue and early partial redemption in December
2009 have rebalanced the debt maturity profile out over several years
and reduced the risk of having a concentrated amount of debt
coming due in any one year.
.Free cash flow increased by $462 million in 2010 when compared
to 2009. The increase reflected lower interest payments due in part to
lower early debt redemption payments, as well as improved EBITDA
and lower capital expenditures, partly offset by higher income tax
payments and lower interest income.
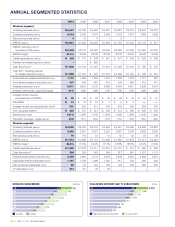
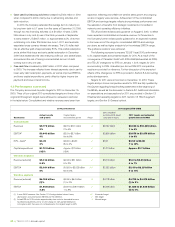
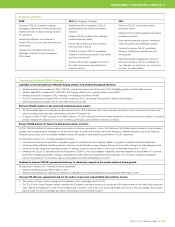
1.4 Performance scorecard
The Company announced its public targets for 2010 on December 15,
2009. Three of four original 2010 consolidated targets and three of four
original 2010 segment targets were achieved or exceeded, as shown
in the table below. Consolidated and wireline revenues were lower than
2010 performance 2011 targets (IFRS-IASB)
2010 unaudited
Actual results Original targets pro forma IFRS-based 2011 targets and estimated
Scorecards and growth and estimated growth Result comparative results growth over 2010 IFRS
Consolidated
Revenues $9.779 billion $9.8 to $10.1 billion ✗ $9.792 billion $9.925 to $10.225 billion
2% 2 to 5% 1 to 4%
EBITDA(1) $3.643 billion $3.5 to $3.7 billion ✓ $3.650 billion $3.675 to $3.875 billion
4% flat to 6% 1 to 6%
EPS – basic(2) $3.23 $2.90 to $3.30 ✓ $3.27 $3.50 to $3.90
3% (8) to 5% 7 to 19%
Capital expenditures $1.721 billion Approx. $1.7 billion ✓ $1.721 billion Approx. $1.7 billion
(18)% (19)%
Wireless segment
Revenue (external) $5.014 billion $4.95 to $5.1 billion ✓ $5.014 billion $5.2 to $5.35 billion
6.5% 5 to 8% 4 to 7%
EBITDA $2.031 billion $1.925 to $2.025 billion ✓✓ $2.022 billion $2.15 to $2.25 billion
5% flat to 5% 6 to 11%
Wireline segment
Revenue (external) $4.765 billion $4.85 to $5.0 billion ✗ $4.778 billion $4.725 to $4.875 billion
(3)% (1) to 2% (1) to 2%
EBITDA $1.612 billion $1.575 to $1.675 billion ✓ $1.628 billion $1.525 to $1.625 billion
3.5% 1 to 8% (6) to 0%
(1) A non-GAAP measure. See Section 11.1 Earnings before interest, taxes, ✓✓ Exceeded target
depreciation and amortization (EBITDA) for the definition. ✓ Met target
(2) Actual EPS for 2010 includes approximately nine cents for favourable income ✗ Missed target
tax-related adjustments and a 12-cent charge for early partial redemption
of long-term debt that were not contemplated in the original target for EPS.