Telus 2010 Annual Report Download - page 114
Download and view the complete annual report
Please find page 114 of the 2010 Telus annual report below. You can navigate through the pages in the report by either clicking on the pages listed below, or by using the keyword search tool below to find specific information within the annual report.-
 1
1 -
2
-
3
-
4
-
5
-
6
-
7
-
8
-
9
-
10
-
11
-
12
-
13
-
14
-
15
-
16
-
17
-
18
-
19
-
20
-
21
-
22
-
23
-
24
-
25
-
26
-
27
-
28
-
29
-
30
-
31
-
32
-
33
-
34
-
35
-
36
-
37
-
38
-
39
-
40
-
41
-
42
-
43
-
44
-
45
-
46
-
47
-
48
-
49
-
50
-
51
-
52
-
53
-
54
-
55
-
56
-
57
-
58
-
59
-
60
-
61
-
62
-
63
-
64
-
65
-
66
-
67
-
68
-
69
-
70
-
71
-
72
-
73
-
74
-
75
-
76
-
77
-
78
-
79
-
80
-
81
-
82
-
83
-
84
-
85
-
86
-
87
-
88
-
89
-
90
-
91
-
92
-
93
-
94
-
95
-
96
-
97
-
98
-
99
-
100
-
101
-
102
-
103
-
 104
104 -
 105
105 -
 106
106 -
 107
107 -
 108
108 -
 109
109 -
 110
110 -
 111
111 -
 112
112 -
 113
113 -
 114
114 -
 115
115 -
 116
116 -
 117
117 -
 118
118 -
 119
119 -
 120
120 -
 121
121 -
 122
122 -
 123
123 -
 124
124 -
125
-
126
-
127
-
128
-
129
-
130
-
131
-
132
-
133
-
134
-
135
-
136
-
137
-
138
-
139
-
140
-
141
-
142
-
143
-
144
-
145
-
146
-
147
-
148
-
149
-
150
-
151
-
152
-
153
-
154
-
155
-
156
-
157
-
158
-
159
-
160
-
161
-
162
-
163
-
164
-
165
-
166
-
167
-
168
-
169
-
170
-
171
-
172
-
173
-
174
-
175
-
176
-
177
-
178
-
179
-
180
-
181
-
182
 |
 |

110 . TELUS 2010 annual report
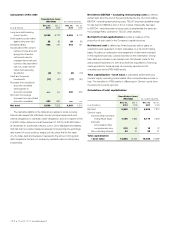
The CICA’s Canadian Performance Reporting Board defined
standardized free cash flow to foster comparability of the measure
between entities. Standardized free cash flow is an indication of
the entity’s capacity to generate discretionary cash from operations,
comprising cash flows from operating activities less net capital expen-
ditures and those dividends that are more representative of interest
costs. It does not necessarily represent the cash flow in the period
available for management to use at its discretion, which may be affected
by other sources and non-discretionary uses of cash. The following
reconciles management’s definition of free cash flow with standardized
free cash flow and Cash provided by operating activities.
Free cash flow reconciliation
Years ended December 31 As currently reported
($ millions) 2010 2009
Cash provided by operating activities 2,546 2,904
Deduct stipulated dividends n.a. n.a.
Deduct capital expenditures (1,721) (2,103)
Proceeds from disposition of capital assets 1 –
Standardized free cash flow
(CICA guideline) 826 801
Other (line item in cash provided
by operating activities) 41 (23)
Reduction (increase) in securitized
accounts receivable 100 (200)
Other net changes in non-cash operating
working capital (20) (93)
Proceeds from disposition of capital assets (1) –
Free cash flow (management’s definition) 947 485
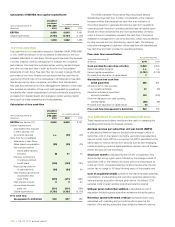
11.3 Definitions of wireless operating indicators
These measures are industry metrics and are useful in assessing the
operating performance of a wireless company.
Average revenue per subscriber unit per month (ARPU)
is calculated as Network revenue divided by the average number of
subscriber units on the network during the period and expressed as a
rate per month. Data ARPU is a component of ARPU, calculated on the
same basis for revenue derived from services such as text messaging,
mobile computing, personal digital assistance devices, Internet browser
activity and pay-per-use downloads.
Churn per month is calculated as the number of subscriber units
disconnected during a given period divided by the average number of
subscriber units on the network during the period, and expressed as
a rate per month. A prepaid subscriber is disconnected when the sub-
scriber has no usage for 90 days following expiry of the prepaid card.
Cost of acquisition (COA) consists of the total of handset subsidies,
commissions, and advertising and promotion expenses related to the
initial subscriber acquisition during a given period. As defined, COA
excludes costs to retain existing subscribers (retention spend).
COA per gross subscriber addition is calculated as cost of
acquisition divided by gross subscriber activations during the period.
Retention spend to Network revenue represents direct costs
associated with marketing and promotional efforts aimed at the
retention of the existing subscriber base divided by Network revenue.
Calculation of EBITDA less capital expenditures
Unaudited
pro forma
Years ended December 31 IFRS-IASB As currently reported
($ millions) 2010 2010 2009
EBITDA 3,650 3,643 3,491
Capital expenditures (1,721) (1,721) (2,103)
1,929 1,922 1,388
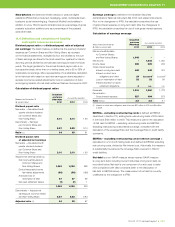
11.2 Free cash flow
Free cash flow is not a calculation based on Canadian GAAP, IFRS-IASB
or U.S. GAAP and should not be considered an alternative to the Con-
solidated statements of cash flows. TELUS reports free cash flow because
it is a key measure used by management to evaluate the Company’s
performance. Free cash flow excludes certain working capital changes
and other sources and uses of cash, as found in the Consolidated
statements of cash flows. Free cash flow can be used to gauge TELUS’
performance over time. Investors are cautioned that free cash flow as
reported by TELUS may not be comparable in all instances to free cash
flow as reported by other companies, and differs from standardized
free cash flow defined by the CICA. Management’s definition of free cash
flow provides an indication of how much cash generated by operations
is available after capital expenditures, but before dividends, acquisitions,
proceeds from divested assets and changes in certain working capital
items (such as trade receivables and trade payables).
Calculation of free cash flow
Unaudited
pro forma
Years ended December 31 IFRS-IASB As currently reported
($ millions) 2010 2010 2009
EBITDA (see Section 11.1) 3,650 3,643 3,491
Deduct donations and
securitization fees included
in Other expense, net,
as currently reported n.a. (33) (25)
Items from the consolidated
statements of cash flows:
Share-based compensation (30) (30) (23)
Net employee defined
benefit plans expense
(recovery) (8) 31 20
Employer contributions
to employee defined
benefit plans (140) (140) (180)
Restructuring costs net
of cash payments (24) (24) 84
Cash interest paid (includes
securitization fees
under IFRS) (479) (471) (567)
Cash interest received 3 3 54
Income taxes refunded
(paid), net (311) (311) (266)
Capital expenditures (1,721) (1,721) (2,103)
Free cash flow
(management’s definition)
940 947 485