Telus 2010 Annual Report Download - page 147
Download and view the complete annual report
Please find page 147 of the 2010 Telus annual report below. You can navigate through the pages in the report by either clicking on the pages listed below, or by using the keyword search tool below to find specific information within the annual report.-
 1
1 -
2
-
3
-
4
-
5
-
6
-
7
-
8
-
9
-
10
-
11
-
12
-
13
-
14
-
15
-
16
-
17
-
18
-
19
-
20
-
21
-
22
-
23
-
24
-
25
-
26
-
27
-
28
-
29
-
30
-
31
-
32
-
33
-
34
-
35
-
36
-
37
-
38
-
39
-
40
-
41
-
42
-
43
-
44
-
45
-
46
-
47
-
48
-
49
-
50
-
51
-
52
-
53
-
54
-
55
-
56
-
57
-
58
-
59
-
60
-
61
-
62
-
63
-
64
-
65
-
66
-
67
-
68
-
69
-
70
-
71
-
72
-
73
-
74
-
75
-
76
-
77
-
78
-
79
-
80
-
81
-
82
-
83
-
84
-
85
-
86
-
87
-
88
-
89
-
90
-
91
-
92
-
93
-
94
-
95
-
96
-
97
-
98
-
99
-
100
-
101
-
102
-
103
-
104
-
105
-
106
-
107
-
108
-
109
-
110
-
111
-
112
-
113
-
114
-
115
-
116
-
117
-
118
-
119
-
120
-
121
-
122
-
123
-
124
-
125
-
126
-
127
-
128
-
129
-
130
-
131
-
132
-
133
-
134
-
135
-
136
-
 137
137 -
 138
138 -
 139
139 -
 140
140 -
 141
141 -
 142
142 -
 143
143 -
 144
144 -
 145
145 -
 146
146 -
 147
147 -
 148
148 -
 149
149 -
 150
150 -
 151
151 -
 152
152 -
 153
153 -
 154
154 -
 155
155 -
 156
156 -
 157
157 -
158
-
159
-
160
-
161
-
162
-
163
-
164
-
165
-
166
-
167
-
168
-
169
-
170
-
171
-
172
-
173
-
174
-
175
-
176
-
177
-
178
-
179
-
180
-
181
-
182
 |
 |

TELUS 2010 annual report . 143
FINANCIAL STATEMENTS & NOTES: 12
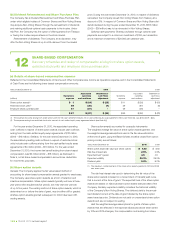
Some share option awards have a net-equity settlement feature.
As discussed further in Note 19(c), it is at the Company’s option
whether the exercise of a share option award is settled as a share
option or settled using the net-equity settlement feature.
Share option awards accounted for as liability instruments:
Substantially all of the Company’s outstanding share option awards
that were granted prior to January 1, 2005, have a net-cash settlement
feature; the optionee has the choice of exercising the net-cash settle-
ment feature. The affected outstanding share option awards largely
take on the characteristics of liability instruments rather than equity
instruments. For the outstanding share option awards that were
amended and which were granted subsequent to 2001, the minimum
expense recognized for them will be their grant-date fair values.
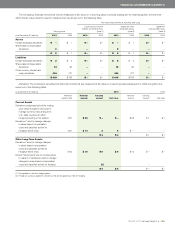
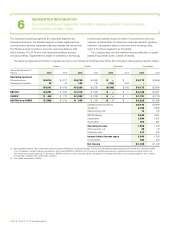
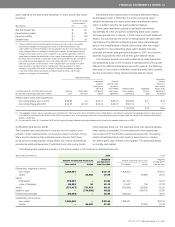
The Company entered into a cash-settled equity swap agreement
that establishes a cap on the Company’s cost associated with substan-
tially all of the affected outstanding share option awards. The following
table sets out the number of affected outstanding share option awards
and the composition of their capped exercise date fair values.
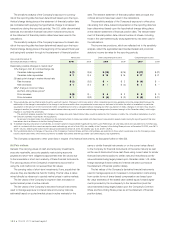
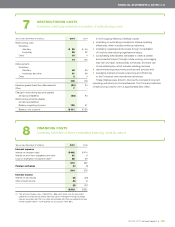
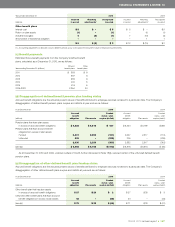
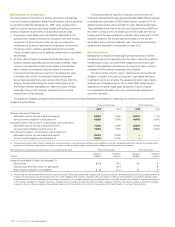
option awards for the year ended December 31, 2010, would have varied
as follows:
Hypothetical change
in assumptions(1)
($ in millions) 10% 20%
Risk free interest rate $ – $ 1
Expected lives (years) $ – $ 1
Expected volatility $ 1 $ 3
Dividend yield $ 1 $ 1
(1) These sensitivities are hypothetical and should be used with caution. Favourable
hypothetical changes in the assumptions result in a decreased amount, and
unfavourable hypothetical changes in the assumptions result in an increased amount,
of the compensation cost arising from share option awards. As the figures indicate,
changes in fair value based on a 10% variation in assumptions generally cannot be
extrapolated because the relationship of the change in assumption to the change in
fair value may not be linear; in particular, variations in expected lives are constrained
by vesting periods and legal lives. Also, in this table, the effect of a variation in a
particular assumption on the amount of the compensation cost arising from share
option awards is calculated without changing any other assumption; in reality,
changes in one factor may result in changes in another (for example, increases
in risk free interest rates may result in increased dividend yields), which might
magnify or counteract the sensitivities.
Weighted average Associated
Incremental Exercise notional
expense date fair value amount of
arising from capped by cash-settled
net-cash cash-settled Affected share Aggregate equity swap
As at December 31, 2010 ($ in millions except Exercise Grant-date settlement equity swap option awards intrinsic agreement
per affected outstanding share option award) price fair value feature agreement outstanding value(1) (Note 5(h))
Affected share option awards granted for
Non-Voting Shares prior to 2002 $ß29.98 n.a.(2) $ß25.17 $ß55.15 834,826 $ß11 $ß43
Non-Voting Shares after 2001 $ß22.28 $ß7.08 $ß25.79 $ß55.15 333,119 7 17
1,167,945 $ß18 $ß60
(1) The aggregate intrinsic value is calculated upon December 31, 2010, per share price of $43.25 for Non-Voting Shares. The difference between the aggregate intrinsic value amount
in this table and the amount disclosed in Note 21(b) is the effect, if any, of recognizing no less than the expense arising from the grant-date fair values for the affected share option
awards outstanding.
(2) As discussed in Note 1(k), Canadian GAAP did not require that grant-date fair values be determined for share option awards made prior to 2002.
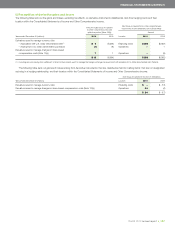
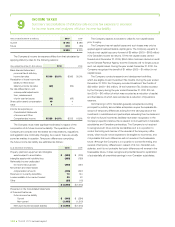
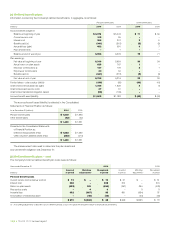
of the restricted stock unit. The restricted stock units become payable
when vesting is completed. The restricted stock units typically vest
over a period of 33 months (the requisite service period). The vesting
method of restricted stock units, which is determined on or before
the date of grant, may be either cliff or graded. The associated liability
is normally cash-settled.
(c) Restricted stock units
The Company uses restricted stock units as a form of incentive com-
pensation. Each restricted stock unit is equal in value to one Non-Voting
Share and the dividends that would have arisen thereon had it been
an issued and outstanding Non-Voting Share; the notional dividends are
recorded as additional issuances of restricted stock units during the life
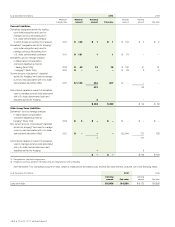
The following table presents a summary of the activity related to the Company’s restricted stock units.
Years ended December 31 2010 2009
Weighted Weighted
Number of restricted stock units average grant- Number of restricted stock units average grant-
Non-vested Vested date fair value Non-vested Vested date fair value
Outstanding, beginning of period
Non-vested 1,385,091 – $ß37.76 1,506,370 – $ß48.15
Vested – 24,226 37.03 – 26,885 50.10
Issued
Initial award 754,057 – 33.82 641,404 – 30.78
In lieu of dividends 90,384 44 40.18 110,637 169 32.23
Vested (771,417) 771,417 43.11 (706,893) 706,893 52.52
Settled in cash – (770,998) 43.28 – (709,721) 52.95
Forfeited and cancelled (99,049) – 36.89 (166,427) – 45.15
Outstanding, end of period
Non-vested 1,359,066 – $ß32.46 1,385,091 – $ß37.76
Vested – 24,689 31.86 – 24,226 37.03