Telus 2010 Annual Report Download - page 67
Download and view the complete annual report
Please find page 67 of the 2010 Telus annual report below. You can navigate through the pages in the report by either clicking on the pages listed below, or by using the keyword search tool below to find specific information within the annual report.-
 1
1 -
2
-
3
-
4
-
5
-
6
-
7
-
8
-
9
-
10
-
11
-
12
-
13
-
14
-
15
-
16
-
17
-
18
-
19
-
20
-
21
-
22
-
23
-
24
-
25
-
26
-
27
-
28
-
29
-
30
-
31
-
32
-
33
-
34
-
35
-
36
-
37
-
38
-
39
-
40
-
41
-
42
-
43
-
44
-
45
-
46
-
47
-
48
-
49
-
50
-
51
-
52
-
53
-
54
-
55
-
56
-
 57
57 -
 58
58 -
 59
59 -
 60
60 -
 61
61 -
 62
62 -
 63
63 -
 64
64 -
 65
65 -
 66
66 -
 67
67 -
 68
68 -
 69
69 -
 70
70 -
 71
71 -
 72
72 -
 73
73 -
 74
74 -
 75
75 -
 76
76 -
 77
77 -
78
-
79
-
80
-
81
-
82
-
83
-
84
-
85
-
86
-
87
-
88
-
89
-
90
-
91
-
92
-
93
-
94
-
95
-
96
-
97
-
98
-
99
-
100
-
101
-
102
-
103
-
104
-
105
-
106
-
107
-
108
-
109
-
110
-
111
-
112
-
113
-
114
-
115
-
116
-
117
-
118
-
119
-
120
-
121
-
122
-
123
-
124
-
125
-
126
-
127
-
128
-
129
-
130
-
131
-
132
-
133
-
134
-
135
-
136
-
137
-
138
-
139
-
140
-
141
-
142
-
143
-
144
-
145
-
146
-
147
-
148
-
149
-
150
-
151
-
152
-
153
-
154
-
155
-
156
-
157
-
158
-
159
-
160
-
161
-
162
-
163
-
164
-
165
-
166
-
167
-
168
-
169
-
170
-
171
-
172
-
173
-
174
-
175
-
176
-
177
-
178
-
179
-
180
-
181
-
182
 |
 |

TELUS 2010 annual report . 63
MANAGEMENT’S DISCUSSION & ANALYSIS: 5
.Voice long distance revenue decreased by $89 million in 2010 when
compared to 2009. The decrease reflects ongoing industry-wide
price competition, losses of local subscribers, and technological
substitution to wireless and Internet-based services.
.Other revenue increased by $5 million in 2010 when compared to
2009. The increase included $8 million of revenue recognized from
CRTC Telecom Decision 2010-900 Review of the large incumbent
local exchange carriers’ support structure service rates partly offset
by lower voice equipment sales.
.Intersegment revenue represents services provided by the wireline
segment to the wireless segment and is eliminated upon consolidation
together with the associated expense in the wireless segment.
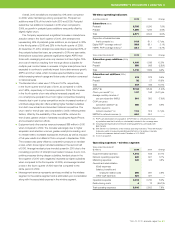
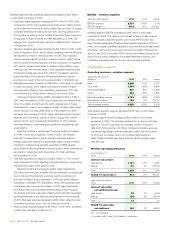
Operating expenses – wireline segment
Years ended December 31
($ millions) 2010 2009 Change
Salaries, benefits and
employee-related costs 1,715 1,811 (5.3)%
Other operations expenses 1,523 1,486 2.5%
Operations expenses 3,238 3,297 (1.8)%
Restructuring costs 70 178 (60.7)%
Total operating expenses 3,308 3,475 (4.8)%
Total wireline operating expenses decreased by $167 million in 2010
when compared to 2009.
.Salaries, benefits and employee-related expenses decreased by
$96 million in 2010 when compared to 2009. The decrease primarily
reflects lower base salaries from fewer domestic FTE employees
and continued reduction of discretionary employee-related expenses
such as travel, partly offset by labour rate inflation in 2010, increased
employee performance bonus compensation expenses due to
improved financial and operating results, and increased defined
benefit plan expenses.
.Other operations expenses increased by $37 million in 2010
when compared to 2009. The increase reflects higher TELUS TV
programming and material costs related to the 85% increase in
the subscriber base, and higher advertising and promotions costs,
partly offset by lower transit and termination costs due to lower
rates, supplier credits, lower cost of goods sold related to lower
overall equipment sales, and one-time operating savings in the
first quarter of 2010.
.Restructuring costs decreased by $108 million in 2010 when
compared to 2009. See discussion in Section 5.3.
EBITDA – wireline segment
Years ended December 31 2010 2009 Change
EBITDA ($ millions) 1,612 1,558 3.5%
EBITDA margin (%) 32.8 31.0 1.8 pts.
Wireline segment EBITDA increased by $54 million in 2010 when
compared to 2009. Improvement in the EBITDA margin resulted from
lower restructuring costs and operating savings realized from efficiency
initiatives to mitigate declining voice revenues, supplemented by a high
margin software application sale in the first quarter of 2010, partially offset
by increased costs associated with the growth in TELUS TV services.
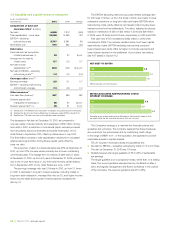
The Company launched its new Optik TV and Optik High Speed
Internet service brands in June 2010, as described in Section 2. This
launch, combined with enhanced bundling capabilities and retention
offers, positively impacted TV and high-speed subscriber additions
in the second half of 2010 relative to the second half of 2009 and
the first half of 2010. In addition, offers by the primary cable-TV com-
petitor in Western Canada were scaled back in the second half of
2010. TELUS upgraded a significant portion of its IP TV subscribers
to Microsoft Mediaroom technology in 2010, with a plan to fully
migrate the rest of the subscriber base in 2011.
.Voice local revenue decreased by $172 million in 2010 when
compared to 2009. The decrease continues to reflect lower basic
access and enhanced voice service revenues caused by com-
petition for residential subscribers, the consequent decline in local
residential access lines and matching of competitive offers, and
technological substitution by wireless and Internet-based services.
The decrease also reflects a decline in business voice lines
from technological substitution to data services, competitor activity
including price competition, and cautious business spending.
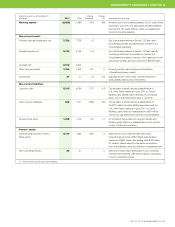
Wireline operating indicators
As at December 31
(000s) 2010 2009 Change
Network access lines (NALs)(1)
Residential 2,046 2,223 (8.0)%
Business 1,693 1,743 (2.9)%
To t a l 3,739 3,966 (5.7)%
Years ended December 31
(000s) 2010 2009 Change
Net (losses) additions in NALs
Residential (177) (175) (1.1)%
Business (50) (35) (42.9)%
To t a l (227) (210) (8.1)%
(1) As a result of a periodic subscriber measurement review and correction during
the first quarter of 2010, historical NALs were restated for the prior periods
commencing in 2007. Total NALs at December 31, 2009, reflect a reduction
of 15,000 residential NALs from the figure reported in the 2009 MD&A, in
respect of TELUS TV subscribers who did not subscribe to voice lines, but
were inadvertently included in NAL counts. Business NALs were reduced by
67,000 from the figure reported in the 2009 MD&A due to the cleanup and
removal of inaccurate subscriber records as part of the integration of billing
and subscriber reporting processes, as well as the consistent application
of industry measurement practices across TELUS.
Residential NALs continue to be affected by wireless and Internet-
based technological substitution for local services, as well as
promotional activity by primary cable-TV competitors in the Company’s
incumbent areas of B.C., Alberta and Eastern Quebec. Residential
NAL losses improved in the second half of 2010 relative to the loss
experience in the second half of 2009 and the first half of 2010 due
to the Company’s enhanced bundling capabilities resulting from its
expanded TV offering with Optik TV and the provision of competitive
retention offers.
Business NAL losses in 2010 reflect increased competition in
the small and medium business market, conversion of voice lines to
more efficient IP services, cautious business spending, and slower
growth in data lines due to the completion of some large enterprise
deals that also included large private IP networks. Growth in certain
data services such as private IP networks is not measured by business
NAL counts, and conversion of legacy voice services to IP services
results in an overall decrease in business NALs.