Telus 2010 Annual Report Download - page 89
Download and view the complete annual report
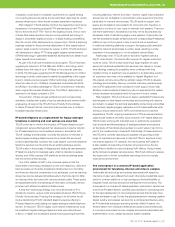
Please find page 89 of the 2010 Telus annual report below. You can navigate through the pages in the report by either clicking on the pages listed below, or by using the keyword search tool below to find specific information within the annual report.-
 1
1 -
2
-
3
-
4
-
5
-
6
-
7
-
8
-
9
-
10
-
11
-
12
-
13
-
14
-
15
-
16
-
17
-
18
-
19
-
20
-
21
-
22
-
23
-
24
-
25
-
26
-
27
-
28
-
29
-
30
-
31
-
32
-
33
-
34
-
35
-
36
-
37
-
38
-
39
-
40
-
41
-
42
-
43
-
44
-
45
-
46
-
47
-
48
-
49
-
50
-
51
-
52
-
53
-
54
-
55
-
56
-
57
-
58
-
59
-
60
-
61
-
62
-
63
-
64
-
65
-
66
-
67
-
68
-
69
-
70
-
71
-
72
-
73
-
74
-
75
-
76
-
77
-
78
-
 79
79 -
 80
80 -
 81
81 -
 82
82 -
 83
83 -
 84
84 -
 85
85 -
 86
86 -
 87
87 -
 88
88 -
 89
89 -
 90
90 -
 91
91 -
 92
92 -
 93
93 -
 94
94 -
 95
95 -
 96
96 -
 97
97 -
 98
98 -
 99
99 -
100
-
101
-
102
-
103
-
104
-
105
-
106
-
107
-
108
-
109
-
110
-
111
-
112
-
113
-
114
-
115
-
116
-
117
-
118
-
119
-
120
-
121
-
122
-
123
-
124
-
125
-
126
-
127
-
128
-
129
-
130
-
131
-
132
-
133
-
134
-
135
-
136
-
137
-
138
-
139
-
140
-
141
-
142
-
143
-
144
-
145
-
146
-
147
-
148
-
149
-
150
-
151
-
152
-
153
-
154
-
155
-
156
-
157
-
158
-
159
-
160
-
161
-
162
-
163
-
164
-
165
-
166
-
167
-
168
-
169
-
170
-
171
-
172
-
173
-
174
-
175
-
176
-
177
-
178
-
179
-
180
-
181
-
182
 |
 |

TELUS 2010 annual report . 85
MANAGEMENT’S DISCUSSION & ANALYSIS: 8
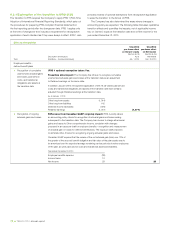
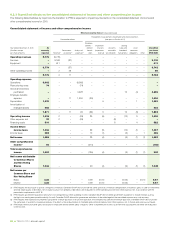
The following summarizes the differences in 2010 by quarter for consolidated Operating revenues, Net income, Total comprehensive income and
earnings per share.
Quarterly differences in key line items
($ millions except per share amounts) 2010 Q4 2010 Q3 2010 Q2 2010 Q1
Operating revenues
As currently reported 2,551 2,455 2,398 2,375
IFRS-IASB (unaudited pro forma) 2,554 2,461 2,400 2,377
Increase under IFRS-IASB 3 6 2 2
Net income
As currently reported 227 247 296 268
IFRS-IASB (unaudited pro forma) 226 251 302 273
Increase (decrease) under IFRS-IASB (1) 4 6 5
Total comprehensive income
As currently reported 225 285 298 284
IFRS-IASB (unaudited pro forma) 27 489 93 283
Increase (decrease) under IFRS-IASB (198) 204 (205) (1)
Net income per Common Share and Non-Voting Share – basic
As currently reported 0.70 0.77 0.92 0.84
IFRS-IASB (unaudited pro forma) 0.70 0.78 0.94 0.85
Increase under IFRS-IASB – 0.01 0.02 0.01
Net income per Common Share and Non-Voting Share – diluted
As currently reported 0.70 0.76 0.92 0.84
IFRS-IASB (unaudited pro forma) 0.70 0.78 0.94 0.85
Increase under IFRS-IASB – 0.02 0.02 0.01
The difference in Total comprehensive income under IFRS reflects variability from actuarial gains and losses for employee defined benefit plans,
recorded in Other comprehensive income as an item that subsequently will never be reclassified to Net income.