Telus 2010 Annual Report Download - page 163
Download and view the complete annual report
Please find page 163 of the 2010 Telus annual report below. You can navigate through the pages in the report by either clicking on the pages listed below, or by using the keyword search tool below to find specific information within the annual report.-
 1
1 -
2
-
3
-
4
-
5
-
6
-
7
-
8
-
9
-
10
-
11
-
12
-
13
-
14
-
15
-
16
-
17
-
18
-
19
-
20
-
21
-
22
-
23
-
24
-
25
-
26
-
27
-
28
-
29
-
30
-
31
-
32
-
33
-
34
-
35
-
36
-
37
-
38
-
39
-
40
-
41
-
42
-
43
-
44
-
45
-
46
-
47
-
48
-
49
-
50
-
51
-
52
-
53
-
54
-
55
-
56
-
57
-
58
-
59
-
60
-
61
-
62
-
63
-
64
-
65
-
66
-
67
-
68
-
69
-
70
-
71
-
72
-
73
-
74
-
75
-
76
-
77
-
78
-
79
-
80
-
81
-
82
-
83
-
84
-
85
-
86
-
87
-
88
-
89
-
90
-
91
-
92
-
93
-
94
-
95
-
96
-
97
-
98
-
99
-
100
-
101
-
102
-
103
-
104
-
105
-
106
-
107
-
108
-
109
-
110
-
111
-
112
-
113
-
114
-
115
-
116
-
117
-
118
-
119
-
120
-
121
-
122
-
123
-
124
-
125
-
126
-
127
-
128
-
129
-
130
-
131
-
132
-
133
-
134
-
135
-
136
-
137
-
138
-
139
-
140
-
141
-
142
-
143
-
144
-
145
-
146
-
147
-
148
-
149
-
150
-
151
-
152
-
 153
153 -
 154
154 -
 155
155 -
 156
156 -
 157
157 -
 158
158 -
 159
159 -
 160
160 -
 161
161 -
 162
162 -
 163
163 -
 164
164 -
 165
165 -
 166
166 -
 167
167 -
 168
168 -
 169
169 -
 170
170 -
 171
171 -
 172
172 -
 173
173 -
174
-
175
-
176
-
177
-
178
-
179
-
180
-
181
-
182
 |
 |

TELUS 2010 annual report . 159
FINANCIAL STATEMENTS & NOTES: 19
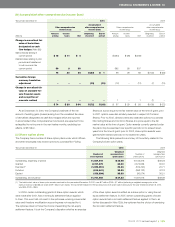
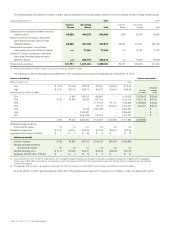
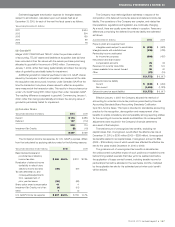
(b) Accumulated other comprehensive income (loss)
Years ended December 31 2010 2009
Accumulated Accumulated
Other comprehensive
other comprehensive
Other comprehensive other comprehensive
income (loss) income (loss) income (loss) income (loss)
Amount Income
Beginning End of
Amount Income Beginning End of
(millions) arising taxes Net of period period arising taxes Net of period period
Change in unrealized fair
value of derivatives
designated as cash
flow hedges
(Note 5(i))
Gains (losses) arising in
current period $ß15 $ß11 $ß 4 $ß(264) $ß(26) $ß(238)
(Gains) losses arising in prior
periods and transferred
to net income in the
current period 59 9 50 362 55 307
74 20 54 $ß(53) $ 1 98 29 69 $ß(122) $ß(53)
Cumulative foreign
currency translation
adjustment – – – (19) (19) (12) – (12) (7) (19)
Change in unrealized fair
value of available-for-
sale financial assets
and recognition of
amounts realized – – – – – 1 – 1 (1) –
$ß74 $ß20 $ß54 $ß(72) $ß(18) $ 87 $ 29 $ 58 $ß(130) $ß(72)
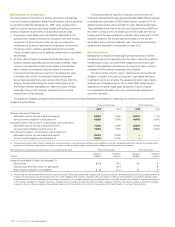
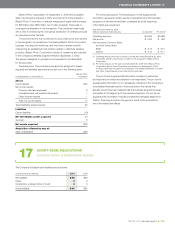
Shares at a price equal to the fair market value at the time of grant; prior
to 2001, options were also similarly awarded in respect of Common
Shares. Prior to 2002, directors were also awarded options to purchase
Non-Voting Shares and Common Shares at a price equal to the fair
market value at the time of grant. Option awards currently granted under
the plans may be exercised over specific periods not to exceed seven
years from the time of grant; prior to 2003, share option awards were
granted with exercise periods not to exceed ten years.
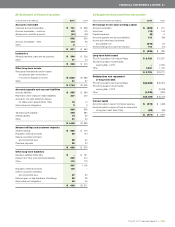
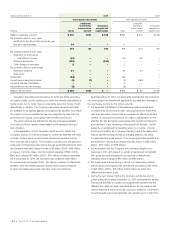
The following table presents a summary of the activity related to the
Company’s share option plans.
As at December 31, 2010, the Company’s estimate of the net
amount of existing gains (losses) arising from the unrealized fair value
of derivatives designated as cash flow hedges which are reported
in accumulated other comprehensive income and are expected to be
reclassified to net income in the next twelve months, excluding tax
effects, is $3 million.
(c) Share option plans
The Company has a number of share option plans under which officers
and other employees may receive options to purchase Non-Voting
Years ended December 31 2010 2009
Weighted Weighted
Number of average share Number of average share
share options option price share options option price
Outstanding, beginning of period 11,057,916 $ß38.08 10,153,316 $ß39.23
Granted 2,787,876 33.00 2,572,556 30.61
Exercised(1) (1,329,351) 29.23 (619,760) 20.71
Forfeited (614,941) 39.55 (958,122) 42.18
Expired (159,834) 35.80 (90,074) 30.21
Outstanding, end of period 11,741,666 $ß37.83 11,057,916 $ß38.08
(1) The total intrinsic value of share option awards exercised for the year ended December 31, 2010, was $17 million (2009 – $7 million) (reflecting a weighted average price at the
dates of exercise of $41.88 per share (2009 – $32.41 per share)). The tax benefit realized for the tax deductions from share option exercises for the year ended December 31, 2010,
was $NIL (2009 – $NIL).
of the share option award is settled as a share option or using the net-
equity settlement feature. In 2007, certain outstanding grants of share
option awards had a net-cash settlement feature applied to them, as
further discussed in Note 12(b); the optionee has the choice of exercising
the net-cash settlement feature.
In 2006, certain outstanding grants of share option awards, which
were made after 2001, had a net-equity settlement feature applied
to them. This event did not result in the optionees receiving incremental
value and therefore modification accounting was not required for it.
The optionee does not have the choice of exercising the net-equity
settlement feature. It is at the Company’s discretion whether an exercise