Telus 2010 Annual Report Download - page 132
Download and view the complete annual report
Please find page 132 of the 2010 Telus annual report below. You can navigate through the pages in the report by either clicking on the pages listed below, or by using the keyword search tool below to find specific information within the annual report.-
 1
1 -
2
-
3
-
4
-
5
-
6
-
7
-
8
-
9
-
10
-
11
-
12
-
13
-
14
-
15
-
16
-
17
-
18
-
19
-
20
-
21
-
22
-
23
-
24
-
25
-
26
-
27
-
28
-
29
-
30
-
31
-
32
-
33
-
34
-
35
-
36
-
37
-
38
-
39
-
40
-
41
-
42
-
43
-
44
-
45
-
46
-
47
-
48
-
49
-
50
-
51
-
52
-
53
-
54
-
55
-
56
-
57
-
58
-
59
-
60
-
61
-
62
-
63
-
64
-
65
-
66
-
67
-
68
-
69
-
70
-
71
-
72
-
73
-
74
-
75
-
76
-
77
-
78
-
79
-
80
-
81
-
82
-
83
-
84
-
85
-
86
-
87
-
88
-
89
-
90
-
91
-
92
-
93
-
94
-
95
-
96
-
97
-
98
-
99
-
100
-
101
-
102
-
103
-
104
-
105
-
106
-
107
-
108
-
109
-
110
-
111
-
112
-
113
-
114
-
115
-
116
-
117
-
118
-
119
-
120
-
121
-
 122
122 -
 123
123 -
 124
124 -
 125
125 -
 126
126 -
 127
127 -
 128
128 -
 129
129 -
 130
130 -
 131
131 -
 132
132 -
 133
133 -
 134
134 -
 135
135 -
 136
136 -
 137
137 -
 138
138 -
 139
139 -
 140
140 -
 141
141 -
 142
142 -
143
-
144
-
145
-
146
-
147
-
148
-
149
-
150
-
151
-
152
-
153
-
154
-
155
-
156
-
157
-
158
-
159
-
160
-
161
-
162
-
163
-
164
-
165
-
166
-
167
-
168
-
169
-
170
-
171
-
172
-
173
-
174
-
175
-
176
-
177
-
178
-
179
-
180
-
181
-
182
 |
 |

128 . TELUS 2010 annual report
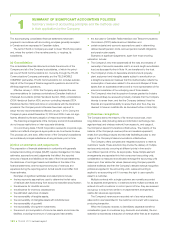
believes that its financial policies and guidelines, which are reviewed
annually, are currently at the optimal level and, by maintaining credit
ratings in the range of BBB+ to A–, or the equivalent, provide reasonable
access to capital.
During 2010, the Company’s strategy, which was unchanged from
2009 (other than to change the dividend payout ratio guideline to 55–65%
of adjusted net earnings on a prospective basis), included maintain-
ing the financial policy set out in the following schedule. The Company
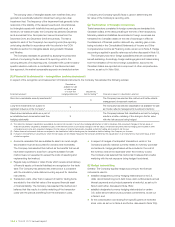
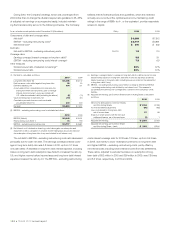
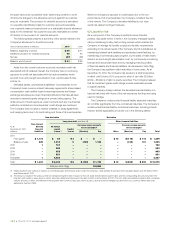
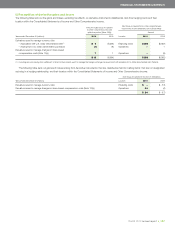
As at, or twelve-month periods ended, December 31 ($ in millions) Policy 2010 2009
Components of debt and coverage ratios
Net debt(1) $ß6,869 $ß7,312
EBITDA – excluding restructuring costs(2) $ß3,717 $ß3,681
Net interest cost(3) $ 510 $ 532
Debt ratio
Net debt to EBITDA – excluding restructuring costs 1.5–2.0 1.8 2.0
Coverage ratios
Earnings coverage (interest coverage on long-term debt)(4) 3.8 3.1
EBITDA – excluding restructuring costs interest coverage(5) 7.3 6.9
Other measures
Dividend payout ratio of adjusted net earnings(6) 65% 67%
Dividend payout ratio 65% 61%
(4) Earnings coverage (interest coverage on long-term debt) is defined as net income
before interest expense on long-term debt and income tax expense, divided by
interest expense on long-term debt (including losses recorded on the redemption
of long-term debt, if any).
(5) EBITDA – excluding restructuring costs interest coverage is defined as EBITDA
– excluding restructuring costs divided by net interest cost. This measure is
substantially the same as the coverage ratio covenant in the Company’s credit
facilities.
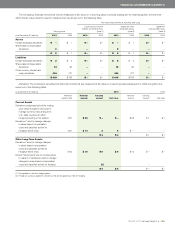
(6) Adjusted net earnings per Common Share and Non-Voting Share is calculated
as follows:
2010 2009
Net income attributable to Common Shares
and Non-Voting Shares $ 1,034 $ 998
Income tax-related adjustments (30) (165)
Loss on redemption of long-term debt,
net of income taxes 37 69
Impacts of share options with the net-cash
settlement feature, net of income taxes (7) 1
Adjusted net earnings $ 1,034 $ 903
Adjusted net earnings per Common Share
and Non-Voting Share – basic $ 3.23 $ß2.84
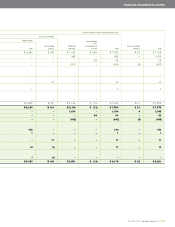
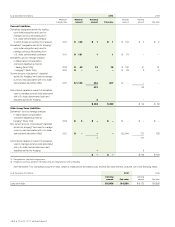
(1) Net debt is calculated as follows:
2010 2009
Long-term debt (Note 18) $ß6,056 $ß6,172
Debt issuance costs netted against long-term debt 28 30
Derivative liabilities, net 404 721
Accumulated other comprehensive income amounts
arising from financial instruments used to manage
interest rate and currency risks associated with
U.S. dollar denominated debt (excluding tax effects) (2) (70)
Cash and temporary investments, net (17) (41)
Cumulative proceeds from accounts receivable
securitization (Note 14) 400 500
Net debt $ß6,869 $ß7,312
(2) EBITDA – excluding restructuring costs is calculated as follows:
2010 2009
EBITDA (Note 6) $ 3,643 $ß3,491
Restructuring costs (Note 7) 74 190
EBITDA – excluding restructuring costs $ 3,717 $ß3,681
(3) Net interest cost is defined as financing costs before gains on redemption and
repayment of debt, calculated on a twelve-month trailing basis (losses recorded on
the redemption of long-term debt, if any, are included in net interest cost).
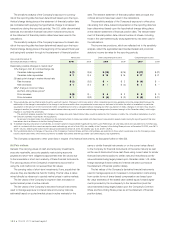
costs interest coverage ratio for 2010 was 7.3 times, up from 6.9 times
in 2009, due mainly to lower redemption premiums on long-term debt
and higher EBITDA – excluding restructuring costs, partly offset by
net interest costs including lower interest income from tax settlements.
These ratios, adjusted to exclude the losses on redemption of long-
term debt of $52 million in 2010 and $99 million in 2009, was 7.8 times
and 8.5 times, respectively, in 2010 and 2009.
The net debt to EBITDA – excluding restructuring costs ratio decreased
principally due to lower net debt. The earnings coverage (interest cover-
age on long-term debt) ratio was 3.8 times in 2010, up from 3.1 times
one year earlier. A decrease in long-term debt interest expense, including
losses on long-term debt redemption (see Note 8), increased the ratio by
0.6, and higher income before income taxes and long-term debt interest
expense increased the ratio by 0.1. The EBITDA – excluding restructuring