Telus 2010 Annual Report Download - page 48
Download and view the complete annual report
Please find page 48 of the 2010 Telus annual report below. You can navigate through the pages in the report by either clicking on the pages listed below, or by using the keyword search tool below to find specific information within the annual report.-
 1
1 -
2
-
3
-
4
-
5
-
6
-
7
-
8
-
9
-
10
-
11
-
12
-
13
-
14
-
15
-
16
-
17
-
18
-
19
-
20
-
21
-
22
-
23
-
24
-
25
-
26
-
27
-
28
-
29
-
30
-
31
-
32
-
33
-
34
-
35
-
36
-
37
-
 38
38 -
 39
39 -
 40
40 -
 41
41 -
 42
42 -
 43
43 -
 44
44 -
 45
45 -
 46
46 -
 47
47 -
 48
48 -
 49
49 -
 50
50 -
 51
51 -
 52
52 -
 53
53 -
 54
54 -
 55
55 -
 56
56 -
 57
57 -
 58
58 -
59
-
60
-
61
-
62
-
63
-
64
-
65
-
66
-
67
-
68
-
69
-
70
-
71
-
72
-
73
-
74
-
75
-
76
-
77
-
78
-
79
-
80
-
81
-
82
-
83
-
84
-
85
-
86
-
87
-
88
-
89
-
90
-
91
-
92
-
93
-
94
-
95
-
96
-
97
-
98
-
99
-
100
-
101
-
102
-
103
-
104
-
105
-
106
-
107
-
108
-
109
-
110
-
111
-
112
-
113
-
114
-
115
-
116
-
117
-
118
-
119
-
120
-
121
-
122
-
123
-
124
-
125
-
126
-
127
-
128
-
129
-
130
-
131
-
132
-
133
-
134
-
135
-
136
-
137
-
138
-
139
-
140
-
141
-
142
-
143
-
144
-
145
-
146
-
147
-
148
-
149
-
150
-
151
-
152
-
153
-
154
-
155
-
156
-
157
-
158
-
159
-
160
-
161
-
162
-
163
-
164
-
165
-
166
-
167
-
168
-
169
-
170
-
171
-
172
-
173
-
174
-
175
-
176
-
177
-
178
-
179
-
180
-
181
-
182
 |
 |

44 . TELUS 2010 annual report
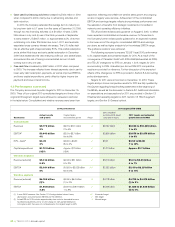
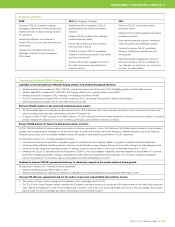
Assumptions for 2010 original targets Result or expectation for 2010
A blended statutory tax rate of approximately 28.5 to 29.5%
(30.3% in 2009). The expected decrease is based on enacted
changes in federal and provincial income tax rates
The blended statutory income tax rate was 29% and the effective
income tax rate was 24%.
Cash income taxes peaking at approximately $385 to $425 million
(net $266 million in 2009) due to the timing of instalment payments
Cash income tax payments net of refunds received were $311 million
in 2010, comprised of instalments for 2010 and final payments for the
2009 tax year made in the first quarter, net of $41 million of refunds for the
settlement of prior years’ matters. The expectation for the full year was
revised to a range of $300 to $350 million on November 5, 2010, and was
previously revised to a range of $330 to $370 million on August 6, 2010.
A pension accounting discount rate was estimated at 5.75% and
subsequently set at 5.85% (140 basis points lower than 2009).
The expected long-term return of 7.25% is unchanged from 2009
and consistent with the Company’s long-run returns and its
future expectations.
.Defined benefit pension plans net expenses were estimated
to be $28 million in 2010 (compared to $18 million in 2009), based
on projected pension fund returns
.Defined benefit pension plans contributions were estimated to be
approximately $143 million in 2010, down from $179 million in 2009,
largely due to the stock market recovery in 2009 and proposed
federal pension reforms.
Defined benefit pension plan expenses were $28 million in 2010 and
are set at the beginning of the year. The Company’s contributions to
defined benefit pension plans in 2010 were $137 million. A $200 million
voluntary contribution was announced in mid-December 2010 and
made in January 2011. See Assumptions for 2011 targets in Section 1.5.
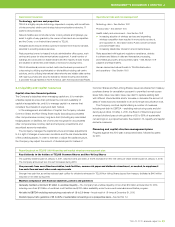
Wireline revenue growth is expected to vary between negative 1%
to positive 2% in 2011, reflecting data growth in business services and
residential entertainment services, offset by continued decreases in
traditional local and long distance service revenues. Wireline EBITDA
is expected to decline between zero and 6% as a result of revenue
declines in higher margin legacy services and continued short-term
dilutive costs associated with Optik TV subscriber growth. This is being
partially offset by growth from lower margin data services, incremental
savings from efficiency activities and a reduction in restructuring costs.
Capital expenditures in 2011 are expected to be similar year-over-year
at approximately $1.7 billion. TELUS expects to continue its broadband
infrastructure expansion and upgrades supporting Optik TV and Internet
services in the top 48 communities in Alberta and B.C., which includes
completing the overlay of VDSL2 technology. In addition, TELUS expects
to continue to enhance wireless network capacity and deploy HSPA+
dual-cell technology to increase the manufacturer-rated data download
speed to up to 42 megabits per second (Mbps).
TELUS will continue to focus on cost reduction in 2011, with a planned
investment of approximately $50 million in restructuring costs ($74 mil-
lion in 2010). TELUS expects to generate approximately $50 million in
incremental operating efficiency savings in 2011 related to restructuring
investments, capital efficiency initiatives and operating efficiency initia-
tives made in 2011 or prior periods (approximately $134 million in 2010).
TELUS made a $200 million voluntary special contribution to
its defined benefit pension plans in January 2011, which is expected to
be accretive to 2011 EBITDA and EPS. Pension contributions are tax
deductible and are expected to reduce cash taxes in 2010 and 2011 by
a total of approximately $57 million.
1.5 Financial and operating targets for 2011
As a result of the convergence of Canadian GAAP with IFRS and TELUS’
changeover to IFRS on January 1, 2011, targets for 2011 are according
to IFRS. Further discussion of the expected effects of the changeover to
IFRS is provided in Section 8.2 Accounting policy developments.
The following assumptions apply to TELUS’ 2011 targets presented
in Scorecards in the previous section. The 2011 targets and assump-
tions were originally announced on December 14, 2010, in the Company’s
annual financial targets news release and accompanying investor
conference call.
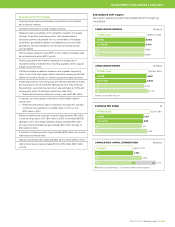
For 2011, TELUS is targeting a consolidated revenue increase over
2010 of 1 to 4% and an EBITDA increase of 1 to 6%. Revenue and
EBITDA are expected to benefit from TELUS’ continued execution in its
data and wireless operations. The growth rate in EBITDA is potentially
higher than the growth rate in revenues due to efficiency activities and
lower expected restructuring costs. Earnings per share (EPS) are targeted
to grow in a range of 7 to 19%, due to operating earnings growth and
lower financing costs.
TELUS wireless revenue is forecast to increase 4 to 7% in 2011 as
a result of continued subscriber growth. Growth in loading is expected
to benefit from a wireless industry penetration gain of approximately
4.5 to five percentage points. TELUS expects to continue to benefit from
its HSPA+ network investments resulting in increased data and roaming
revenues helping to offset continued declines in voice ARPU. Wireless
EBITDA is expected to be 6 to 11% higher in 2011, despite the impact on
margins of increased investments in customer acquisition and retention.