Telus 2010 Annual Report Download - page 156
Download and view the complete annual report
Please find page 156 of the 2010 Telus annual report below. You can navigate through the pages in the report by either clicking on the pages listed below, or by using the keyword search tool below to find specific information within the annual report.-
 1
1 -
2
-
3
-
4
-
5
-
6
-
7
-
8
-
9
-
10
-
11
-
12
-
13
-
14
-
15
-
16
-
17
-
18
-
19
-
20
-
21
-
22
-
23
-
24
-
25
-
26
-
27
-
28
-
29
-
30
-
31
-
32
-
33
-
34
-
35
-
36
-
37
-
38
-
39
-
40
-
41
-
42
-
43
-
44
-
45
-
46
-
47
-
48
-
49
-
50
-
51
-
52
-
53
-
54
-
55
-
56
-
57
-
58
-
59
-
60
-
61
-
62
-
63
-
64
-
65
-
66
-
67
-
68
-
69
-
70
-
71
-
72
-
73
-
74
-
75
-
76
-
77
-
78
-
79
-
80
-
81
-
82
-
83
-
84
-
85
-
86
-
87
-
88
-
89
-
90
-
91
-
92
-
93
-
94
-
95
-
96
-
97
-
98
-
99
-
100
-
101
-
102
-
103
-
104
-
105
-
106
-
107
-
108
-
109
-
110
-
111
-
112
-
113
-
114
-
115
-
116
-
117
-
118
-
119
-
120
-
121
-
122
-
123
-
124
-
125
-
126
-
127
-
128
-
129
-
130
-
131
-
132
-
133
-
134
-
135
-
136
-
137
-
138
-
139
-
140
-
141
-
142
-
143
-
144
-
145
-
 146
146 -
 147
147 -
 148
148 -
 149
149 -
 150
150 -
 151
151 -
 152
152 -
 153
153 -
 154
154 -
 155
155 -
 156
156 -
 157
157 -
 158
158 -
 159
159 -
 160
160 -
 161
161 -
 162
162 -
 163
163 -
 164
164 -
 165
165 -
 166
166 -
167
-
168
-
169
-
170
-
171
-
172
-
173
-
174
-
175
-
176
-
177
-
178
-
179
-
180
-
181
-
182
 |
 |

152 . TELUS 2010 annual report
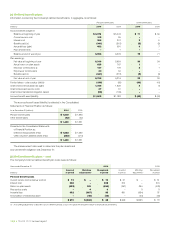
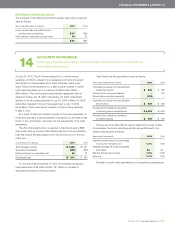
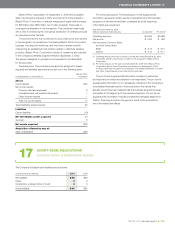
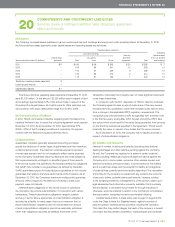
At December 31, 2010, key economic assumptions and the sensitivity
of the current fair value of residual cash flows to immediate 10% and
20% changes in those assumptions were as follows:
Hypothetical change
December 31, in assumptions(1)
($ in millions) 2010 10% 20%
Carrying amount/fair value
of future cash flows $ß60
Expected credit losses as
a percentage of accounts
receivable sold $ß– $ß1
Weighted average life of the
receivables sold (days) $ß– $ß–
Effective annual discount rate $ß– $ß–
(1) These sensitivities are hypothetical and should be used with caution. Favourable
hypothetical changes in the assumptions result in an increased value, and unfavourable
hypothetical changes in the assumptions result in a decreased value, of the retained
interest in receivables sold. As the figures indicate, changes in fair value based on a
10% variation in assumptions generally cannot be extrapolated because the relationship
of the change in assumption to the change in fair value may not be linear. Also, in this
table, the effect of a variation in a particular assumption on the fair value of the retained
interest is calculated without changing any other assumption; in reality, changes in
one factor may result in changes in another (for example, increases in market interest
rates may result in increased credit losses), which might magnify or counteract
the sensitivities.
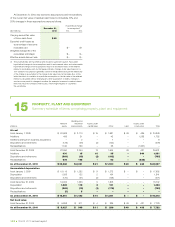
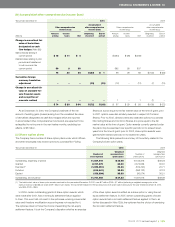
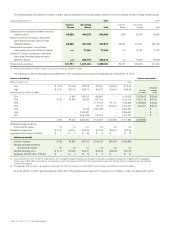
15 PROPERTY, PLANT AND EQUIPMENT
Summary schedule of items comprising property, plant and equipment
Buildings and
Network leasehold Assets under Assets under
(millions) assets improvements capital lease Other Land construction To t a l
At cost
As at January 1, 2009 $ 20,609 $ 2,110 $ 15 $ 1,681 $ 49 $ß 485 $ 24,949
Additions 406 21 – 42 – 1,283 1,752
Additions arising from business acquisitions – 2 – 7 – – 9
Dispositions and retirements (125) (28) (2) (124) – – (279)
Reclassifications 1,160 139 – 38 – (1,337) –
As at December 31, 2009 22,050 2,244 13 1,644 49 431 26,431
Additions 431 15 10 35 – 840 1,331
Dispositions and retirements (568) (13) (2) (182) – – (765)
Reclassifications 675 105 – 53 – (833) –
As at December 31, 2010 $ß22,588 $ß2,351 $ß21 $ß1,550 $ß49 $ 438 $ß26,997
Accumulated depreciation
As at January 1, 2009 $ 15,119 $ 1,232 $ 9 $ 1,272 $ – $ß – $ 17,632
Depreciation 1,053 122 2 164 – – 1,341
Dispositions and retirements (120) (21) (2) (128) – – (271)
As at December 31, 2009 16,052 1,333 9 1,308 – – 18,702
Depreciation 1,082 118 2 131 – – 1,333
Dispositions and retirements (568) (13) (1) (178) – – (760)
Reclassifications (5) 5 – – – – –
As at December 31, 2010 $ß16,561 $ß1,443 $ß10 $ß1,261 $ß – $ – $ß19,275
Net book value
As at December 31, 2009 $ 5,998 $ß 911 $ 4 $ß 336 $ 49 $ß 431 $ 7,729
As at December 31, 2010 $ß 6,027 $ 908 $ß11 $ 289 $ß49 $ 438 $ß 7,722