Telus 2010 Annual Report Download - page 37
Download and view the complete annual report
Please find page 37 of the 2010 Telus annual report below. You can navigate through the pages in the report by either clicking on the pages listed below, or by using the keyword search tool below to find specific information within the annual report.-
 1
1 -
2
-
3
-
4
-
5
-
6
-
7
-
8
-
9
-
10
-
11
-
12
-
13
-
14
-
15
-
16
-
17
-
18
-
19
-
20
-
21
-
22
-
23
-
24
-
25
-
26
-
 27
27 -
 28
28 -
 29
29 -
 30
30 -
 31
31 -
 32
32 -
 33
33 -
 34
34 -
 35
35 -
 36
36 -
 37
37 -
 38
38 -
 39
39 -
 40
40 -
 41
41 -
 42
42 -
 43
43 -
 44
44 -
 45
45 -
 46
46 -
 47
47 -
48
-
49
-
50
-
51
-
52
-
53
-
54
-
55
-
56
-
57
-
58
-
59
-
60
-
61
-
62
-
63
-
64
-
65
-
66
-
67
-
68
-
69
-
70
-
71
-
72
-
73
-
74
-
75
-
76
-
77
-
78
-
79
-
80
-
81
-
82
-
83
-
84
-
85
-
86
-
87
-
88
-
89
-
90
-
91
-
92
-
93
-
94
-
95
-
96
-
97
-
98
-
99
-
100
-
101
-
102
-
103
-
104
-
105
-
106
-
107
-
108
-
109
-
110
-
111
-
112
-
113
-
114
-
115
-
116
-
117
-
118
-
119
-
120
-
121
-
122
-
123
-
124
-
125
-
126
-
127
-
128
-
129
-
130
-
131
-
132
-
133
-
134
-
135
-
136
-
137
-
138
-
139
-
140
-
141
-
142
-
143
-
144
-
145
-
146
-
147
-
148
-
149
-
150
-
151
-
152
-
153
-
154
-
155
-
156
-
157
-
158
-
159
-
160
-
161
-
162
-
163
-
164
-
165
-
166
-
167
-
168
-
169
-
170
-
171
-
172
-
173
-
174
-
175
-
176
-
177
-
178
-
179
-
180
-
181
-
182
 |
 |

TELUS 2010 annual report . 33
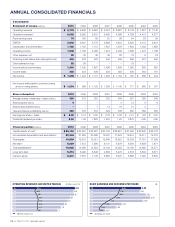
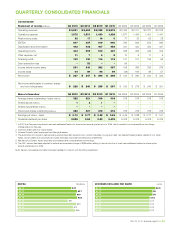
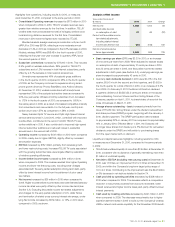
QUARTERLY CONSOLIDATED FINANCIALS
919
937
906
923
873
789
847
940
EBITDA ($ millions)
Q4 10
Q3 10
Q2 10
Q1 10
Q4 09
Q3 09
Q2 09
Q1 09
50
50
47.5
47.5
47.5
47.5
52.5
47.5
DIVIDENDS DECLARED PER SHARE (cents)
Q4 10
Q3 10
Q2 10
Q1 10
Q4 09
Q3 09
Q2 09
Q1 09
Consolidated
Statement of income (millions) Q4 2010 Q3 2010 Q2 2010 Q1 2010 Q4 2009 Q3 2009 Q2 2009 Q1 2009
Operating revenues $ß2,551 $ß2,455 $ß2,398 $ß2,375 $ß2,443 $ß2,411 $ß2,377 $ß2,375
Operations expense 1,672 1,501 1,460 1,429 1,577 1,456 1,451 1,441
Restructuring costs 32 17 19 6 77 32 53 28
EBITDA 847 937 919 940 789 923 873 906
Depreciation and amortization 443 432 407 453 441 430 424 427
Operating income 404 505 512 487 348 493 449 479
Other expense, net 11 7 6 8 10 6 11 5
Financing costs 102 130 114 112 131 101 106 95
Debt redemption loss – 52 – – 99 – – –
Income before income taxes 291 316 392 367 108 386 332 379
Income taxes 64 69 96 99 (48) 106 88 57
Net income $ 227 $ 247 $ 296 $ 268 $ 156 $ 280 $ 244 $ 322
Net income attributable to common shares
and non-voting shares $ 226 $ 246 $ 295 $ 267 $ 155 $ 279 $ 243 $ 321
Share information2 Q4 2010 Q3 2010 Q2 2010 Q1 2010 Q4 2009 Q3 2009 Q2 2009 Q1 2009
Average shares outstanding – basic (millions) 322 321 319 318 318 318 318 318
Shares issued (millions) 1 2 1 – – – – –
Shares repurchased (millions) – – – – – – – –
Period-end shares outstanding (millions) 322 321 319 318 318 318 318 318
Earnings per share – basic $ß 0.70 $ß 0.77 $ß 0.92 $ß 0.84 $ß 0.49 $ß 0.88 $ß 0.77 $ß 1.01
Dividends declared per share 0.525 0.50 0.50 0.475 0.475 0.475 0.475 0.475
1 In 2007, the Company introduced a net-cash settlement feature for share option awards granted prior to 2005, which resulted in an incremental pre-tax charge
of $169 million for that year.
2 Common shares and non-voting shares.
3 Includes Property, plant, equipment and Intangible assets.
4 The summation of Long-term debt excluding unamortized debt issuance cost, current maturities of Long-term debt, net deferred hedging liability related to U.S. dollar
Notes, and proceeds from securitized accounts receivable, less Cash and temporary investments.
5 Net debt plus Owners’ equity excluding accumulated other comprehensive income (loss).
6 The 2007 amount has been adjusted to exclude an incremental charge of $169 million relating to the introduction of a net-cash settlement feature for share option
awards granted prior to 2005.
Note: Certain comparative information has been restated to conform with the 2010 presentation.