Telus 2010 Annual Report Download - page 88
Download and view the complete annual report
Please find page 88 of the 2010 Telus annual report below. You can navigate through the pages in the report by either clicking on the pages listed below, or by using the keyword search tool below to find specific information within the annual report.-
 1
1 -
2
-
3
-
4
-
5
-
6
-
7
-
8
-
9
-
10
-
11
-
12
-
13
-
14
-
15
-
16
-
17
-
18
-
19
-
20
-
21
-
22
-
23
-
24
-
25
-
26
-
27
-
28
-
29
-
30
-
31
-
32
-
33
-
34
-
35
-
36
-
37
-
38
-
39
-
40
-
41
-
42
-
43
-
44
-
45
-
46
-
47
-
48
-
49
-
50
-
51
-
52
-
53
-
54
-
55
-
56
-
57
-
58
-
59
-
60
-
61
-
62
-
63
-
64
-
65
-
66
-
67
-
68
-
69
-
70
-
71
-
72
-
73
-
74
-
75
-
76
-
77
-
 78
78 -
 79
79 -
 80
80 -
 81
81 -
 82
82 -
 83
83 -
 84
84 -
 85
85 -
 86
86 -
 87
87 -
 88
88 -
 89
89 -
 90
90 -
 91
91 -
 92
92 -
 93
93 -
 94
94 -
 95
95 -
 96
96 -
 97
97 -
 98
98 -
99
-
100
-
101
-
102
-
103
-
104
-
105
-
106
-
107
-
108
-
109
-
110
-
111
-
112
-
113
-
114
-
115
-
116
-
117
-
118
-
119
-
120
-
121
-
122
-
123
-
124
-
125
-
126
-
127
-
128
-
129
-
130
-
131
-
132
-
133
-
134
-
135
-
136
-
137
-
138
-
139
-
140
-
141
-
142
-
143
-
144
-
145
-
146
-
147
-
148
-
149
-
150
-
151
-
152
-
153
-
154
-
155
-
156
-
157
-
158
-
159
-
160
-
161
-
162
-
163
-
164
-
165
-
166
-
167
-
168
-
169
-
170
-
171
-
172
-
173
-
174
-
175
-
176
-
177
-
178
-
179
-
180
-
181
-
182
 |
 |

84 . TELUS 2010 annual report
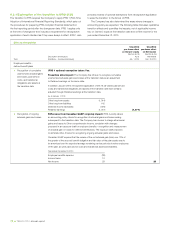
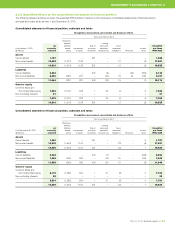
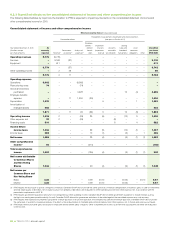
8.2.3 Quantified effects on the consolidated statement of income and other comprehensive income
The following table illustrates by topic how the transition to IFRS is expected to impact key line items on the consolidated statement of income and
other comprehensive income for 2010.
Consolidated statement of income and other comprehensive income
Effects on key line items (Increase (decrease))
Recognition, measurement, presentation and disclosure effects
Presentation effects (see topics in Section 8.2.1)
Employee
benefits – Impairment Leasing
Year ended December 31, 2010 As defined of assets Accounts (sales and Asset Unaudited
($ millions except currently Government Analysis of benefit (impairment receivable leaseback retirement pro forma
per share amounts) reported Revenue(1) assistance(2) expenses(3) plans reversal) securitization transactions) obligations Other IFRS-IASB
Operating revenues 9,779 (9,779) – – – – – – – – –
Services – 9,168 (37) – – – – – – – 9,131
Equipment – 611 – – – – – – – – 611
9,779 – (37) – – – – – – – 9,742
Other operating income – 2 48 – – – – – – – 50
9,779 2 11 – – – – – – – 9,792
Operating expenses
Operations 6,062 – – (6,062) – – – – – – –
Restructuring costs 74 – – (74) – – – – – – –
Goods and services
purchased – – – 4,228 – – – 12 (4) – 4,236
Employee benefits
expense – – 11 1,934 (39) – – – – – 1,906
Depreciation 1,333 – – – – 5 – – 1 – 1,339
Amortization of
intangible assets 402 – – – – – – – – – 402
7,871 – 11 26 (39) 5 – 12 (3) – 7,883
Operating income 1,908 2 – (26) 39 (5) – (12) 3 – 1,909
Other expense, net 32 2 – (26) – – (8) – – – –
Financing costs 510 – – – – – 8 – 4 – 522
Income before
income taxes 1,366 – – – 39 (5) – (12) (1) – 1,387
Income taxes 328 – – – 10 (1) – (3) – 1 335
Net income 1,038 – – – 29 (4) – (9) (1) (1) 1,052
Other comprehensive
income(4) 54 – – – (214) – – – – – (160)
Total comprehensive
income 1,092 – – – (185) (4) – (9) (1) (1) 892
Net income attributable
to Common Shares
and Non-Voting
Shares 1,034 – – – 29 (4) – (9) (1) (1) 1,048
Net income per
Common Share and
Non-Voting Share
Basic 3.23 – – – 0.09 (0.01) – (0.03) – (0.01) 3.27
Diluted 3.22 – – – 0.09 (0.01) – (0.03) – – 3.27
(1) IFRS requires the disclosure of specific categories of revenue. Canadian GAAP did not provide the same specificity of revenue categorization. In addition, gains on sale of investments
and real estate assets of $4 million, net of equity losses in non-affiliates of $2 million, are reclassified to Other operating income from Other expense, net, in accordance with the
presentation requirements of IAS 18.
(2) IFRS requires government assistance amounts to be categorized as Other operating income. Canadian GAAP did not define government assistance to include receipts such as
the high-cost serving area portable subsidy. As well, Canadian GAAP allowed for government assistance to be netted against the associated expense as a cost recovery.
(3) IFRS requires that expenses be presented using either a nature approach or a function approach; the Company has selected the nature approach. Canadian GAAP did not provide
the same level of specificity of expense analysis. One effect is the reclassification of charitable and political donations from Other expense, net, to Goods and services purchased.
(4) IFRS impact reflects actuarial gains and losses for employee defined benefit plans charged to Other comprehensive income, as an item that subsequently will never be reclassified
to Net income.