Telus 2010 Annual Report Download - page 41
Download and view the complete annual report
Please find page 41 of the 2010 Telus annual report below. You can navigate through the pages in the report by either clicking on the pages listed below, or by using the keyword search tool below to find specific information within the annual report.-
 1
1 -
2
-
3
-
4
-
5
-
6
-
7
-
8
-
9
-
10
-
11
-
12
-
13
-
14
-
15
-
16
-
17
-
18
-
19
-
20
-
21
-
22
-
23
-
24
-
25
-
26
-
27
-
28
-
29
-
30
-
 31
31 -
 32
32 -
 33
33 -
 34
34 -
 35
35 -
 36
36 -
 37
37 -
 38
38 -
 39
39 -
 40
40 -
 41
41 -
 42
42 -
 43
43 -
 44
44 -
 45
45 -
 46
46 -
 47
47 -
 48
48 -
 49
49 -
 50
50 -
 51
51 -
52
-
53
-
54
-
55
-
56
-
57
-
58
-
59
-
60
-
61
-
62
-
63
-
64
-
65
-
66
-
67
-
68
-
69
-
70
-
71
-
72
-
73
-
74
-
75
-
76
-
77
-
78
-
79
-
80
-
81
-
82
-
83
-
84
-
85
-
86
-
87
-
88
-
89
-
90
-
91
-
92
-
93
-
94
-
95
-
96
-
97
-
98
-
99
-
100
-
101
-
102
-
103
-
104
-
105
-
106
-
107
-
108
-
109
-
110
-
111
-
112
-
113
-
114
-
115
-
116
-
117
-
118
-
119
-
120
-
121
-
122
-
123
-
124
-
125
-
126
-
127
-
128
-
129
-
130
-
131
-
132
-
133
-
134
-
135
-
136
-
137
-
138
-
139
-
140
-
141
-
142
-
143
-
144
-
145
-
146
-
147
-
148
-
149
-
150
-
151
-
152
-
153
-
154
-
155
-
156
-
157
-
158
-
159
-
160
-
161
-
162
-
163
-
164
-
165
-
166
-
167
-
168
-
169
-
170
-
171
-
172
-
173
-
174
-
175
-
176
-
177
-
178
-
179
-
180
-
181
-
182
 |
 |

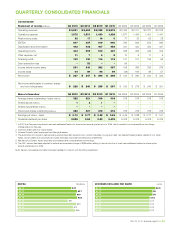
TELUS 2010 annual report . 37
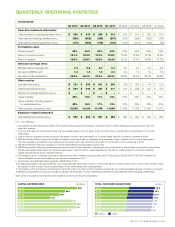
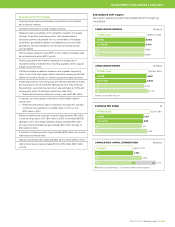
Q4 2010 Q3 2010 Q2 2010 Q1 2010 Q4 2009 Q3 2009 Q2 2009 Q1 2009
Wireless segment
Operating revenues (millions) $ß1,347 $ß1,290 $ß1,226 $ß1,184 $ß1,232 $ß1,213 $ß1,153 $ß1,137
Operations expense (millions) 871 753 703 685 794 693 656 647
Restructuring costs (millions) – 2 – 2 3 3 4 2
EBITDA (millions) $ 476 $ 535 $ 523 $ 497 $ 435 $ 517 $ 493 $ 488
EBITDA excluding COA (millions) $ 660 $ 693 $ 665 $ 611 $ 598 $ 652 $ 618 $ 604
EBITDA margin 35.3% 41.5% 42.7% 42.0% 35.3% 42.6% 42.8% 42.9%
Capital expenditures (millions) $ 192 $ 113 $ 99 $ 59 $ 192 $ 193 $ 189 $ 196
Payment for wireless spectrum (millions) – – – – – – – –
Cash flow (millions)3 $ 284 $ 422 $ 424 $ 438 $ 243 $ 324 $ 304 $ 292
Cash flow3 including payment
for wireless spectrum (millions) $ 284 $ 422 $ 424 $ 438 $ 243 $ 324 $ 304 $ 292
Gross additions wireless subscribers (000s) 475 466 413 356 431 420 402 346
Net additions wireless subscribers (000s) 119 153 124 51 122 125 111 48
Wireless subscribers (000s)5 6,971 6,852 6,699 6,575 6,524 6,413 6,288 6,177
Wireless market share, subscriber-based 27% 28% 28% 28% 28% 28% 28% 28%
ARPU $ 58 $ 59 $ 57 $ 56 $ 57 $ 59 $ 59 $ 58
Data ARPU $ 16 $ 15 $ 14 $ 13 $ 13 $ 12 $ 12 $ 11
Average minutes per subscriber per month 352 361 373 359 389 397 402 382
COA, per gross addition $ 388 $ 339 $ 342 $ 322 $ 380 $ 320 $ 311 $ 336
Monthly churn rate 1.72% 1.54% 1.45% 1.55% 1.60% 1.55% 1.55% 1.62%
Population coverage – digital (millions)6 33.8 33.7 33.7 33.7 33.1 32.7 32.7 32.7
Wireline segment
Operating revenues (millions) $ß1,253 $ß1,212 $ß1,221 $ß1,234 $ß1,254 $ß1,239 $ß1,262 $ß1,278
Operations expense (millions) 850 795 806 787 826 804 833 834
Restructuring costs (millions) 32 15 19 4 74 29 49 26
EBITDA (millions) $ 371 $ 402 $ 396 $ 443 $ 354 $ 406 $ 380 $ 418
EBITDA margin 29.6% 33.2% 32.4% 35.9% 28.2% 32.8% 30.1% 32.7%
Capital expenditures (millions) $ 372 $ 336 $ 298 $ 252 $ 322 $ 365 $ 368 $ 278
Cash flow (millions)3 (1) 66 98 191 32 41 12 140
Network access lines in service (000s)7 3,739 3,794 3,845 3,908 3,966 4,019 4,075 4,123
High-speed Internet subscribers (000s)8 1,167 1,149 1,134 1,131 1,128 1,117 1,108 1,105
Dial-up Internet subscribers (000s) 62 68 73 80 87 96 105 114
TV subscribers (000s)9 314 266 228 199 170 137 115 98
n.a. – not available
1 In 2007, the Company introduced a net-cash settlement feature for share option awards granted prior to 2005, which resulted in an incremental pre-tax charge
of $24 million for that year for the wireless segment and $145 million for the wireline segment.
2 EBITDA for 2007 excludes the net-cash settlement feature expense of $24 million for the wireless segment and $145 million for the wireline segment.
3 EBITDA less capital expenditures.
4 Includes the impact of TELUS’ analogue network turndown in Q3 2008, which reduced net additions by 27,635.
5
Opening balances for postpaid subscribers and total wireless subscribers for the fourth quarter of 2009 were reduced by 11,000 to reflect prior period reporting adjustments.
6 Includes expanded coverage resulting from roaming/resale and network sharing agreements principally with Bell Canada.
7 Historical Network access lines updated for prior periods commencing in 2007.
8 Opening balances for high-speed Internet subscribers and total Internet subscribers for the second quarter of 2009 were reduced by 5,000 to reflect prior period
reporting adjustments.
9 TV subscribers consists of TELUS Optik TV subscribers and TELUS Satellite TV subscribers.
Note: Certain comparative information has been restated to conform with the 2010 presentation.
QUARTERLY SEGMENTED STATISTICS