Telus 2010 Annual Report Download - page 61
Download and view the complete annual report
Please find page 61 of the 2010 Telus annual report below. You can navigate through the pages in the report by either clicking on the pages listed below, or by using the keyword search tool below to find specific information within the annual report.-
 1
1 -
2
-
3
-
4
-
5
-
6
-
7
-
8
-
9
-
10
-
11
-
12
-
13
-
14
-
15
-
16
-
17
-
18
-
19
-
20
-
21
-
22
-
23
-
24
-
25
-
26
-
27
-
28
-
29
-
30
-
31
-
32
-
33
-
34
-
35
-
36
-
37
-
38
-
39
-
40
-
41
-
42
-
43
-
44
-
45
-
46
-
47
-
48
-
49
-
50
-
 51
51 -
 52
52 -
 53
53 -
 54
54 -
 55
55 -
 56
56 -
 57
57 -
 58
58 -
 59
59 -
 60
60 -
 61
61 -
 62
62 -
 63
63 -
 64
64 -
 65
65 -
 66
66 -
 67
67 -
 68
68 -
 69
69 -
 70
70 -
 71
71 -
72
-
73
-
74
-
75
-
76
-
77
-
78
-
79
-
80
-
81
-
82
-
83
-
84
-
85
-
86
-
87
-
88
-
89
-
90
-
91
-
92
-
93
-
94
-
95
-
96
-
97
-
98
-
99
-
100
-
101
-
102
-
103
-
104
-
105
-
106
-
107
-
108
-
109
-
110
-
111
-
112
-
113
-
114
-
115
-
116
-
117
-
118
-
119
-
120
-
121
-
122
-
123
-
124
-
125
-
126
-
127
-
128
-
129
-
130
-
131
-
132
-
133
-
134
-
135
-
136
-
137
-
138
-
139
-
140
-
141
-
142
-
143
-
144
-
145
-
146
-
147
-
148
-
149
-
150
-
151
-
152
-
153
-
154
-
155
-
156
-
157
-
158
-
159
-
160
-
161
-
162
-
163
-
164
-
165
-
166
-
167
-
168
-
169
-
170
-
171
-
172
-
173
-
174
-
175
-
176
-
177
-
178
-
179
-
180
-
181
-
182
 |
 |

TELUS 2010 annual report . 57
include a $52 million loss on early redemption of approximately 45%
of the principal amount of 8% U.S. dollar Notes (maturity June 2011)
and unwinding of related cross currency interest rate swaps. Similarly,
financing costs in the fourth quarter of 2009 include a $99 million
loss for a similar early partial redemption of these Notes. Each partial
redemption was financed with a new 10-year, $1 billion 5.05% Note
issue (see discussion in Section 7.3).
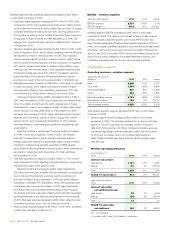
The trends in Net income and earnings per share (EPS) reflect the
items noted above, as well as adjustments arising from legislated income
tax changes, settlements and tax reassessments for prior years, includ-
ing any related interest on reassessments. The information presented
below for 2009 has been revised from that reported in fiscal 2009, and
now excludes investment tax credits.
expense in the fourth quarter of 2009 resulted from growth in capital
assets in service, including the wireless HSPA+ network launched
in November 2009.
The increase in Amortization of intangible assets in 2010 resulted
from implementation of HSPA+ services in November 2009. Offsetting
this in the second quarter of 2010 was a reduction of approximately
$5 million for investment tax credits (ITCs) following determination
of eligibility by taxation authorities, for assets capitalized in prior years
that are now fully amortized. Similarly, ITCs reduced amortization
by approximately $10 million in the fourth quarter of 2009.
Financing costs for each period shown are also net of varying amounts
of interest income, including interest from the settlement of prior years’
income tax-related matters. Financing costs in the third quarter of 2010
MANAGEMENT’S DISCUSSION & ANALYSIS: 5
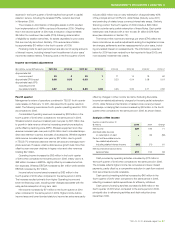
Income tax-related adjustments
($ in millions, except EPS amounts) 2010 Q4 2010 Q3 2010 Q2 2010 Q1 2009 Q4 2009 Q3 2009 Q2 2009 Q1
Approximate Net
income impact 10 9 10 1 71 14 18 62
Approximate EPS impact 0.03 0.03 0.03 – 0.23 0.04 0.06 0.19
Approximate basic EPS
excluding income
tax-related impacts 0.67 0.74 0.89 0.84 0.26 0.84 0.71 0.82
offset by changes in other income tax items. Excluding favourable
income tax-related adjustments, charges for the early partial redemption
of U.S. dollar Notes and termination of related cross currency interest
rate swaps, underlying Net income increased by $63 million in the fourth
quarter when compared to the same period in 2009, as shown below.
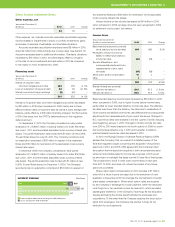
Analysis of Net income
Quarters ended December 31
($ millions) 2010 2009 Change
Net income 227 156 71
Add back after-tax loss
on redemption of debt – 69 (69)
Deduct net favourable income
tax-related adjustments,
including related interest income (10) (71) 61
Net income before above items
(approximate) 217 154 63
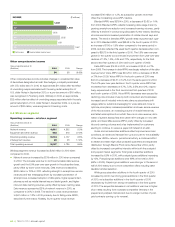
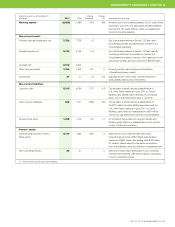
Cash provided by operating activities increased by $72 million in
the fourth quarter of 2010 when compared to the same period in 2009.
The increase reflects higher income tax recoveries and lower interest
payments, partly offset by a comparative reduction in cash flow received
from securitized accounts receivable.
Cash used by investing activities increased by $46 million in the
fourth quarter of 2010 when compared to the same period in 2009,
reflecting increased capital expenditures for efficiency initiatives.
Cash used by financing activities increased by $66 million in the
fourth quarter of 2010 when compared to the same period in 2009,
principally due to refinancing activities and debt reduction since
December 2009.
Fourth quarter
Management’s review of operations contained in TELUS’ fourth quarter
news release on February 11, 2011, discussed fourth quarter results in
detail. The following summarizes fourth quarter operating results in 2010,
as compared to 2009.
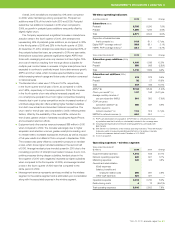
Consolidated Operating revenues increased by $108 million in the
fourth quarter of 2010 when compared to the same period in 2009.
Wireless network revenue increased year-over-year by $97 million due
to growth in data revenue driven by increasing smartphone adoption,
partly offset by declining voice ARPU. Wireless equipment and other
revenue increased year-over-year by $16 million due to increased acqui-
sition and retention volumes, and sales of accessories. Wireline segment
data revenue increased year-over-year by $37 million due to growth
in TELUS TV, enhanced data and Internet services and managed work-
place revenues. However, wireline data revenue growth was more than
offset by year-over-year declines in legacy voice and other revenues
totalling $42 million.
Operating income increased by $56 million in the fourth quarter
of 2010 when compared to the same period in 2009, mainly due to a
$58 million increase in EBITDA, slightly offset by increased amortiza-
tion expenses. Wireless EBITDA increased by $41 million while wireline
EBITDA increased by $17 million.
Income before income taxes increased by $183 million in the
fourth quarter of 2010 when compared to the same period in 2009.
The increase resulted primarily from higher Operating income and
lower net financing costs, including lower charges associated with the
early partial redemption of long-term debt.
Net income increased by $71 million in the fourth quarter of 2010
when compared to the same period in 2009. Higher income before
income taxes and lower blended statutory income tax rates were partly