Telus 2010 Annual Report Download - page 138
Download and view the complete annual report
Please find page 138 of the 2010 Telus annual report below. You can navigate through the pages in the report by either clicking on the pages listed below, or by using the keyword search tool below to find specific information within the annual report.-
 1
1 -
2
-
3
-
4
-
5
-
6
-
7
-
8
-
9
-
10
-
11
-
12
-
13
-
14
-
15
-
16
-
17
-
18
-
19
-
20
-
21
-
22
-
23
-
24
-
25
-
26
-
27
-
28
-
29
-
30
-
31
-
32
-
33
-
34
-
35
-
36
-
37
-
38
-
39
-
40
-
41
-
42
-
43
-
44
-
45
-
46
-
47
-
48
-
49
-
50
-
51
-
52
-
53
-
54
-
55
-
56
-
57
-
58
-
59
-
60
-
61
-
62
-
63
-
64
-
65
-
66
-
67
-
68
-
69
-
70
-
71
-
72
-
73
-
74
-
75
-
76
-
77
-
78
-
79
-
80
-
81
-
82
-
83
-
84
-
85
-
86
-
87
-
88
-
89
-
90
-
91
-
92
-
93
-
94
-
95
-
96
-
97
-
98
-
99
-
100
-
101
-
102
-
103
-
104
-
105
-
106
-
107
-
108
-
109
-
110
-
111
-
112
-
113
-
114
-
115
-
116
-
117
-
118
-
119
-
120
-
121
-
122
-
123
-
124
-
125
-
126
-
127
-
 128
128 -
 129
129 -
 130
130 -
 131
131 -
 132
132 -
 133
133 -
 134
134 -
 135
135 -
 136
136 -
 137
137 -
 138
138 -
 139
139 -
 140
140 -
 141
141 -
 142
142 -
 143
143 -
 144
144 -
 145
145 -
 146
146 -
 147
147 -
 148
148 -
149
-
150
-
151
-
152
-
153
-
154
-
155
-
156
-
157
-
158
-
159
-
160
-
161
-
162
-
163
-
164
-
165
-
166
-
167
-
168
-
169
-
170
-
171
-
172
-
173
-
174
-
175
-
176
-
177
-
178
-
179
-
180
-
181
-
182
 |
 |

134 . TELUS 2010 annual report
date. The relevant statement of financial position date principal and
notional amounts have been used in the calculations.
The sensitivity analysis of the Company’s exposure to other price
risk arising from share-based compensation at the reporting date has
been determined based upon the hypothetical change taking place
at the relevant statement of financial position date. The relevant state-
ment of financial position date notional number of shares, including
those in the cash-settled equity swap agreements, has been used in
the calculations.
The income tax provisions, which are reflected net in the sensitivity
analysis, reflect the applicable basic blended federal and provincial
statutory income tax rates for the reporting periods.
The sensitivity analysis of the Company’s exposure to currency
risk at the reporting date has been determined based upon the hypo-
thetical change taking place at the statement of financial position date
(as contrasted with applying the hypothetical change to all relevant
transactions during the reported periods). The U.S. dollar denominated
balances and derivative financial instrument notional amounts as
at the statement of financial position dates have been used in the
calculations.
The sensitivity analysis of the Company’s exposure to interest rate
risk at the reporting date has been determined based upon the hypo-
thetical change taking place at the beginning of the relevant fiscal year
and being held constant through to the statement of financial position
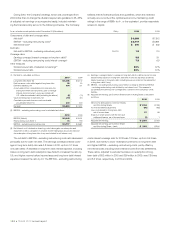
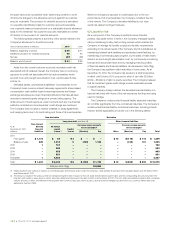
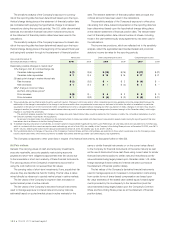
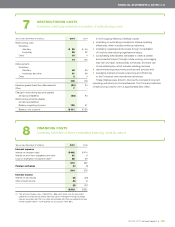
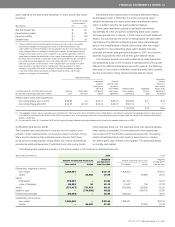
Years ended December 31 Net income Other comprehensive income Comprehensive income
($ increase (decrease) in millions) 2010 2009 2010 2009 2010 2009
Reasonably possible changes in market risks(1)
10% change in Cdn. $: U.S.$ exchange rate
Canadian dollar appreciates $ß(7) $ß(5) $ß(10) $ß(16) $ß(17) $ß(21)
Canadian dollar depreciates $ 7 $ 5 $ 10 $ 16 $ 17 $ 21
25 basis point change in market interest rate
Rate increases $ß(1) $ß(2) $ – $ 2 $ß (1) $ –
Rate decreases $ 1 $ 2 $ – $ß (2) $ 1 $ –
25%(2) change in Common Share
and Non-Voting Share prices(3)
Price increases $ß(2) $ – $ 4 $ 3 $ 2 $ 3
Price decreases $ 1 $ß(8) $ß (4) $ß (3) $ß (3) $ß(11)
(1) These sensitivities are hypothetical and should be used with caution. Changes in net income and/or other comprehensive income generally cannot be extrapolated because the
relationship of the change in assumption to the change in net income and/or other comprehensive income may not be linear. In this table, the effect of a variation in a particular
assumption on the amount of net income and/or other comprehensive income is calculated without changing any other assumption; in reality, changes in one factor may result in
changes in another (for example, increases in market interest rates may result in more favourable foreign exchange rates (increased strength of the Canadian dollar)), which might
magnify or counteract the sensitivities.
The sensitivity analysis assumes that changes in exchange rates and market interest rates would be realized by the Company; in reality, the competitive marketplace in which
the Company operates would impact this assumption.
No provision has been made for a difference in the notional number of shares associated with share-based compensation awards made during the reporting period that may
have arisen due to a difference in the Non-Voting Share price.
(2) To facilitate ongoing comparison of sensitivities, a constant variance of approximate magnitude has been used. Reflecting a 4.5-year data period and calculated on a monthly basis,
which is consistent with the current assumptions and methodology set out in Note 12(b), the volatility of the Company’s Non-Voting Share price as at December 31, 2010, was 26.7%
(2009 – 26.4%); reflecting the twelve-month data period ended December 31, 2010, the volatility was 14.2% (2009 – 26.9%).
(3) The hypothetical effects of changes in the prices of the Company’s Common Shares and Non-Voting Shares are restricted to those which would arise from the Company’s share-
based compensation items which are accounted for as liability instruments and the associated cash-settled equity swap agreements.
The Company is exposed to other price risks in respect of its financial instruments, as discussed further in Note 5(f).
same or similar financial instruments or on the current rates offered
to the Company for financial instruments of the same maturity as well
as the use of discounted future cash flows using current rates for similar
financial instruments subject to similar risks and maturities (such fair
value estimates being largely based upon Canadian dollar: U.S. dollar
foreign exchange forward rates and interest rate yield curves as at
the statement of financial position dates).
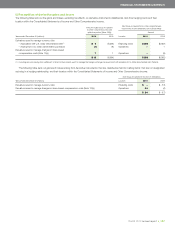
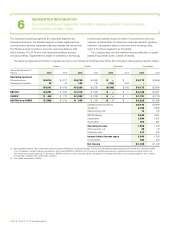
The fair values of the Company’s derivative financial instruments
used to manage exposure to increases in compensation costs arising
from certain forms of share-based compensation are based upon
fair value estimates of the related cash-settled equity forward agree-
ments provided by the counterparty to the transactions (such fair
value estimates being largely based upon the Company’s Common
Share and Non-Voting Share prices as at the statement of financial
position dates).
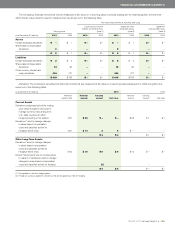
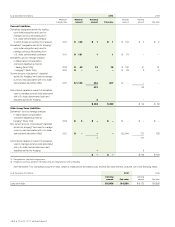
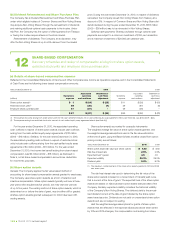
(h) Fair values
General: The carrying values of cash and temporary investments,
accounts receivable, accounts payable, restructuring accounts
payable and short-term obligations approximate their fair values due
to the immediate or short-term maturity of these financial instruments.
The carrying values of the Company’s investments accounted for
using the cost method do not exceed their fair values.
The carrying value of short-term investments, if any, equals their fair
value as they are classified as held for trading. The fair value is deter-
mined directly by reference to quoted market prices in active markets.
The fair values of the Company’s long-term debt are based on
quoted market prices in active markets.
The fair values of the Company’s derivative financial instruments
used to manage exposure to interest rate and currency risks are
estimated based on quoted market prices in active markets for the