Telus 2010 Annual Report Download - page 72
Download and view the complete annual report
Please find page 72 of the 2010 Telus annual report below. You can navigate through the pages in the report by either clicking on the pages listed below, or by using the keyword search tool below to find specific information within the annual report.-
 1
1 -
2
-
3
-
4
-
5
-
6
-
7
-
8
-
9
-
10
-
11
-
12
-
13
-
14
-
15
-
16
-
17
-
18
-
19
-
20
-
21
-
22
-
23
-
24
-
25
-
26
-
27
-
28
-
29
-
30
-
31
-
32
-
33
-
34
-
35
-
36
-
37
-
38
-
39
-
40
-
41
-
42
-
43
-
44
-
45
-
46
-
47
-
48
-
49
-
50
-
51
-
52
-
53
-
54
-
55
-
56
-
57
-
58
-
59
-
60
-
61
-
 62
62 -
 63
63 -
 64
64 -
 65
65 -
 66
66 -
 67
67 -
 68
68 -
 69
69 -
 70
70 -
 71
71 -
 72
72 -
 73
73 -
 74
74 -
 75
75 -
 76
76 -
 77
77 -
 78
78 -
 79
79 -
 80
80 -
 81
81 -
 82
82 -
83
-
84
-
85
-
86
-
87
-
88
-
89
-
90
-
91
-
92
-
93
-
94
-
95
-
96
-
97
-
98
-
99
-
100
-
101
-
102
-
103
-
104
-
105
-
106
-
107
-
108
-
109
-
110
-
111
-
112
-
113
-
114
-
115
-
116
-
117
-
118
-
119
-
120
-
121
-
122
-
123
-
124
-
125
-
126
-
127
-
128
-
129
-
130
-
131
-
132
-
133
-
134
-
135
-
136
-
137
-
138
-
139
-
140
-
141
-
142
-
143
-
144
-
145
-
146
-
147
-
148
-
149
-
150
-
151
-
152
-
153
-
154
-
155
-
156
-
157
-
158
-
159
-
160
-
161
-
162
-
163
-
164
-
165
-
166
-
167
-
168
-
169
-
170
-
171
-
172
-
173
-
174
-
175
-
176
-
177
-
178
-
179
-
180
-
181
-
182
 |
 |

68 . TELUS 2010 annual report
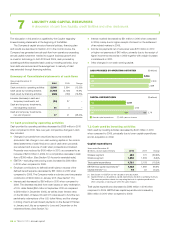
The EBITDA (excluding restructuring costs) interest coverage ratio
for 2010 was 7.3 times, up from 6.9 times in 2009, due mainly to lower
redemption premiums on long-term debt and higher EBITDA before
restructuring costs, partly offset by net interest costs including lower
interest income from tax settlements. The ratios, adjusted to exclude
losses on redemption of debt of $52 million in 2010 and $99 million
in 2009, were 7.8 times and 8.5 times, respectively, in 2010 and 2009.
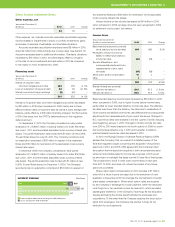
Free cash flow (FCF) increased by $462 million in 2010 when
compared to 2009. The increase resulted mainly from lower capital
expenditures, higher EBITDA excluding restructuring costs and
lower interest paid, partly offset by higher income tax payments and
lower interest received on the settlement of prior years’ tax matters.
See FCF details in Section 11.2.
10
09
08
NET DEBT TO EBITDA
10 1.8
2.0
1. 9
09
08
08
EBITDA excludes restructuring costs.
10
09
08
07
EBITDA (EXCLUDING RESTRUCTURING COSTS)
INTEREST COVERAGE
10 7.3
6.9
8.3
09
08
08
Excluding losses on debt redemption of $99 million in 2009 and $52 million in 2010,
the ratio in 2009 was 8.5 times and the ratio in 2010 was 7.8 times.
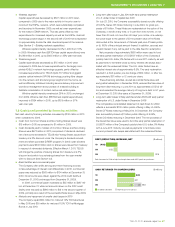
The Company’s strategy is to maintain the financial policies and
guidelines set out below. The Company believes that these measures
are currently at the optimal level and by maintaining credit ratings
in the range of BBB+ to A–, or the equivalent, are expected to provide
reasonable access to capital markets.
TELUS’ long-term financial policies and guidelines are:
.Net debt to EBITDA – excluding restructuring costs of 1.5 to 2.0 times
The ratio at December 31, 2010 was 1.8 times.
.Dividend payout ratio target guideline of 55 to 65% of sustainable
net earnings
The target guideline is on a prospective basis, rather than on a trailing
basis. The current guideline was approved by the Board on May 4,
2010, and signals management and Board confidence in the outlook
of the Company. The previous guideline was 45 to 55%.
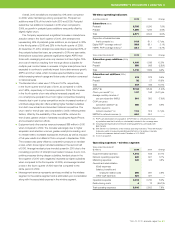
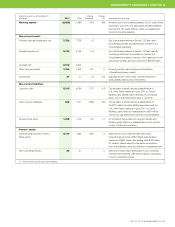
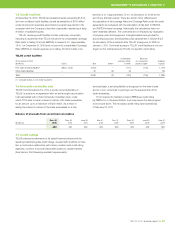
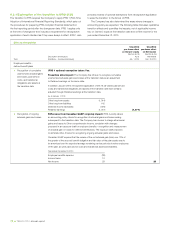
7.4 Liquidity and capital resource measures
As at, or years ended,
December 31 2010 2009 Change
Components of debt and
coverage ratios(1) ($ millions)
Net debt 6,869 7,312 (443)
Total capitalization – book value 15,088 14,959 129
EBITDA – excluding
restructuring costs 3,717 3,681 36
Net interest cost 510 532 (22)
Debt ratios
Fixed-rate debt as a proportion
of total indebtedness (%) 93 87 6 pts.
Average term to maturity
of debt (years) 5.7 5.0 0.7
Net debt to total
capitalization (%)(1)(2) 45.5 48.9 (3.4) pts.
Net debt to EBITDA – excluding
restructuring costs(1)(2) 1.8 2.0 (0.2)
Coverage ratios (times)(1)(2)
Earnings coverage 3.8 3.1 0.7
EBITDA – excluding restructuring
costs interest coverage 7.3 6.9 0.4
Other measures(2)
Free cash flow ($ millions)(3) 947 485 462
Dividend payout ratio(1)
of adjusted net earnings (%) 65 67 (2) pts.
Dividend payout ratio(1) (%) 65 61 4 pts.
(1) See Section 11.4 Definition and calculation of liquidity and capital resource measures.
(2) See Section 8.2.4 for pro forma differences in measures under IFRS for fiscal 2010.
(3) See Section 11.2 Free cash flow for the definition and calculation.
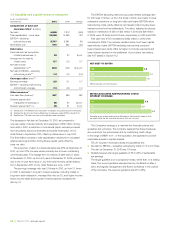
The decrease in Net debt at December 31, 2010, as compared to
one year earlier, includes maturity and repayment of $80 million of long-
term debt in 2010, a reduction in commercial paper, reduced proceeds
from securitized accounts receivable and partial redemption of U.S.
dollar Notes in September 2010, offset by a Note issue in July 2010.
The $129 million increase in total capitalization resulted from increased
retained earnings and Non-Voting Share capital, partly offset by
lower net debt.
The proportion of debt on a fixed-rate basis was 93% at December 31,
2010, up from 87% one year earlier primarily due to lower outstanding
commercial paper. The average term to maturity of debt was 5.7 years
at December 31, 2010, up from 5.0 years at December 31, 2009, primarily
due to the 10-year Note issue in July 2010 and the early partial redemp-
tion in September 2010 of U.S. dollar Notes due June 1, 2011.
The earnings coverage ratio was 3.8 times in 2010, up from 3.1 times
in 2009. A decrease in long-term interest expense, including losses on
long-term debt redemption, increased the ratio by 0.6, and higher income
before income taxes and long-term interest expense increased the
ratio by 0.1.