Telus 2010 Annual Report Download - page 8
Download and view the complete annual report
Please find page 8 of the 2010 Telus annual report below. You can navigate through the pages in the report by either clicking on the pages listed below, or by using the keyword search tool below to find specific information within the annual report.-
 1
1 -
 2
2 -
 3
3 -
 4
4 -
 5
5 -
 6
6 -
 7
7 -
 8
8 -
 9
9 -
 10
10 -
 11
11 -
 12
12 -
 13
13 -
 14
14 -
 15
15 -
 16
16 -
 17
17 -
 18
18 -
 19
19 -
20
-
21
-
22
-
23
-
24
-
25
-
26
-
27
-
28
-
29
-
30
-
31
-
32
-
33
-
34
-
35
-
36
-
37
-
38
-
39
-
40
-
41
-
42
-
43
-
44
-
45
-
46
-
47
-
48
-
49
-
50
-
51
-
52
-
53
-
54
-
55
-
56
-
57
-
58
-
59
-
60
-
61
-
62
-
63
-
64
-
65
-
66
-
67
-
68
-
69
-
70
-
71
-
72
-
73
-
74
-
75
-
76
-
77
-
78
-
79
-
80
-
81
-
82
-
83
-
84
-
85
-
86
-
87
-
88
-
89
-
90
-
91
-
92
-
93
-
94
-
95
-
96
-
97
-
98
-
99
-
100
-
101
-
102
-
103
-
104
-
105
-
106
-
107
-
108
-
109
-
110
-
111
-
112
-
113
-
114
-
115
-
116
-
117
-
118
-
119
-
120
-
121
-
122
-
123
-
124
-
125
-
126
-
127
-
128
-
129
-
130
-
131
-
132
-
133
-
134
-
135
-
136
-
137
-
138
-
139
-
140
-
141
-
142
-
143
-
144
-
145
-
146
-
147
-
148
-
149
-
150
-
151
-
152
-
153
-
154
-
155
-
156
-
157
-
158
-
159
-
160
-
161
-
162
-
163
-
164
-
165
-
166
-
167
-
168
-
169
-
170
-
171
-
172
-
173
-
174
-
175
-
176
-
177
-
178
-
179
-
180
-
181
-
182
 |
 |

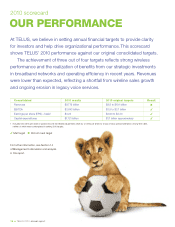
4 . TELUS 2010 annual report
DRIVEN TO
EXCEL
2000: Revenue, EBITDA, net income and EPS are 12 months from June 30, 2000. Free cash flow is for year ended Dec. 31, 2000. Subscribers and enterprise value are as at Jan. 1, 2000.
2010: Revenue, EBITDA, net income, EPS and free cash flow are for the year ended Dec. 31, 2010. Subscribers and enterprise value are as at Dec. 31, 2010.
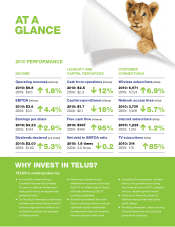
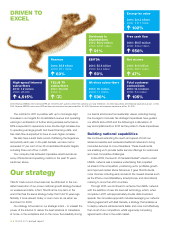
Revenue
2010: $9.8 billion
2000: $6.0 billion
63%
Total customer
connections
2010: 12.3 million
2000: 6.0 million
105%
High-speed Internet
subscribers
2010: 1.2 million
2000: 26,000
4,515%
Enterprise value
2010: $21.2 billion
2000: $10.5 billion
102%
Dividends to
shareholders
2010: $642 million
2000: $336 million
91%
TELUS TV
subscribers
2010: 314,000
2000: 0
∞
Wireless subscribers
2010: 7.0 million
2000: 1.1 million
536%
EBITDA
2010: $3.6 billion
2000: $2.4 billion
50%
Net income
2010: $1.0 billion
2000: $681 million
47%
The outlook for 2011 is positive with up to mid-single-digit
increases in our targets for consolidated revenue and operating
earnings in anticipation of further strong wireless performance.
EPS is expected to experience a low double-digit increase due
to operating earnings growth and lower financing costs, and
free cash flow is expected to have an even higher increase.
We also have a solid track record of attaining the targets we
set publicly each year. In the past decade, we have met or
exceeded 77 per cent of our 48 consolidated financial targets,
including three out of four in 2010.
Your company has achieved impressive results across an
array of financial and operating metrics in the past 10 years,
as shown above.
Our strategy
TELUS’ track record of success can be attributed to the con-
sistent execution of our proven national growth strategy focused
on wireless and data. In fact, TELUS is the only telco in the
world that has the same strategy today that it did 10 years ago.
Notably, it is as relevant today, or even more so, as when we
launched it in 2000.
Our strategy is founded on our strategic intent – to unleash the
power of the Internet to deliver the best solutions to Canadians
at home, in the workplace and on the move. Successfully driving
our team’s actions are four leadership values, including having
the courage to innovate. Six strategic imperatives have guided
our efforts since 2000 and the following is a discussion of
key accomplishments in 2010 as they relate to these imperatives.
Building national capabilities
We continued extending the reach and speed of both our
advanced wireline and wireless broadband networks to bring
innovative services to more Canadians. These investments
are enabling us to provide better service offerings for customers
and meet competitive challenges.
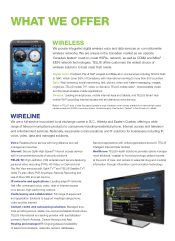
In late 2009, the launch of Canada’s fastest* coast-to-coast
HSPA+ network was a massive undertaking that propelled
us ahead of the competition, positioning us for profitable growth
and improved market share. Moreover, it gave TELUS clients
more choices, including early access to the newest devices such
as the iPhone 4 and BlackBerry smartphones, and international
roaming to more than 200 countries.
Through 2010, we continued to enhance the HSPA+ network
with the addition of new 4G dual-cell technology, which, when
complete in 2011, will approximately double data download
speeds. Our innovative approach includes leveraging our network
sharing agreement with Bell Canada, a strategy that enables us
to deploy network enhancements faster and more cost effectively
than most of our competitors, whilst vigorously competing
against each other in the retail market.
Free cash flow
2010: $947 million
2000: $144 million
558%