Telus 2010 Annual Report Download - page 66
Download and view the complete annual report
Please find page 66 of the 2010 Telus annual report below. You can navigate through the pages in the report by either clicking on the pages listed below, or by using the keyword search tool below to find specific information within the annual report.-
 1
1 -
2
-
3
-
4
-
5
-
6
-
7
-
8
-
9
-
10
-
11
-
12
-
13
-
14
-
15
-
16
-
17
-
18
-
19
-
20
-
21
-
22
-
23
-
24
-
25
-
26
-
27
-
28
-
29
-
30
-
31
-
32
-
33
-
34
-
35
-
36
-
37
-
38
-
39
-
40
-
41
-
42
-
43
-
44
-
45
-
46
-
47
-
48
-
49
-
50
-
51
-
52
-
53
-
54
-
55
-
 56
56 -
 57
57 -
 58
58 -
 59
59 -
 60
60 -
 61
61 -
 62
62 -
 63
63 -
 64
64 -
 65
65 -
 66
66 -
 67
67 -
 68
68 -
 69
69 -
 70
70 -
 71
71 -
 72
72 -
 73
73 -
 74
74 -
 75
75 -
 76
76 -
77
-
78
-
79
-
80
-
81
-
82
-
83
-
84
-
85
-
86
-
87
-
88
-
89
-
90
-
91
-
92
-
93
-
94
-
95
-
96
-
97
-
98
-
99
-
100
-
101
-
102
-
103
-
104
-
105
-
106
-
107
-
108
-
109
-
110
-
111
-
112
-
113
-
114
-
115
-
116
-
117
-
118
-
119
-
120
-
121
-
122
-
123
-
124
-
125
-
126
-
127
-
128
-
129
-
130
-
131
-
132
-
133
-
134
-
135
-
136
-
137
-
138
-
139
-
140
-
141
-
142
-
143
-
144
-
145
-
146
-
147
-
148
-
149
-
150
-
151
-
152
-
153
-
154
-
155
-
156
-
157
-
158
-
159
-
160
-
161
-
162
-
163
-
164
-
165
-
166
-
167
-
168
-
169
-
170
-
171
-
172
-
173
-
174
-
175
-
176
-
177
-
178
-
179
-
180
-
181
-
182
 |
 |

62 . TELUS 2010 annual report
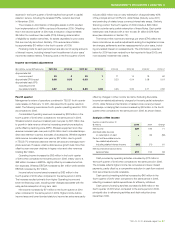
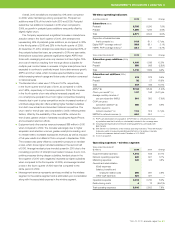
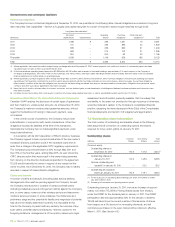
EBITDA – wireless segment
Years ended December 31 2010 2009 Change
EBITDA ($ millions) 2,031 1,933 5.1%
EBITDA margin (%) 40.2 40.8 (0.6) pts.
Wireless segment EBITDA increased by $98 million in 2010 when
compared to 2009. This reflects improvement in terms of data revenue
growth, postpaid subscriber growth, lower voice ARPU erosion and
lower bad debt expenses. Wireless margins were pressured in 2010 pri-
marily due to higher combined acquisition and retention costs associated
with higher volumes and continued smartphone adoption following the
launch in late 2009 of the new HSPA+ network and related devices such
as the iPhone, earlier availability of the latest BlackBerry devices, and
increased competitive intensity driving higher handset subsidies.
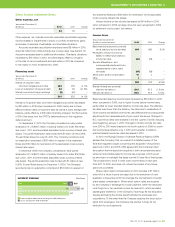
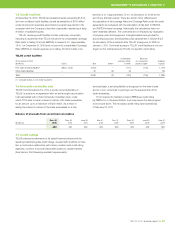
5.5 Wireline segment
Operating revenues – wireline segment
Years ended December 31
($ millions) 2010 2009 Change
Data 2,268 2,146 5.7%
Voice local 1,684 1,856 (9.3)%
Voice long distance 530 619 (14.4)%
Other 283 278 1.8%
External operating revenue 4,765 4,899 (2.7)%
Intersegment revenue 155 134 15.7%
Total operating revenue 4,920 5,033 (2.2)%
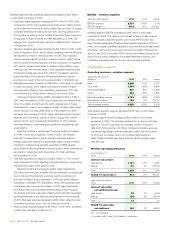
Total wireline segment revenue decreased $113 million in 2010 when
compared to 2009.
.Wireline data revenues increased by $122 million in 2010 when
compared to 2009. The increase resulted from: (i) strong subscriber
growth in TELUS TV services; (ii) increased Internet, enhanced
data and hosting services; (iii) higher managed workplace revenues
including a high margin software application sale in the first quarter
of 2010; and to a lesser extent, (iv) increased data equipment
sales. These increases were partly offset by declining legacy basic
data services.
Wireline operating indicators
As at December 31
(000s) 2010 2009 Change
Internet subscribers
High-speed 1,167 1,128 3.5%
Dial-up 62 87 (28.7)%
To t a l 1,229 1,215 1.2%
TELUS TV subscribers(1) 314 170 84.7%
Years ended December 31
(000s) 2010 2009 Change
Internet subscriber
net additions (losses)
High-speed 39 37 5.4%
Dial-up (25) (37) 32.4%
To t a l 14 – n/m
TELUS TV subscriber
net additions(1) 144 92 56.5%
n/m – not meaningful.
(1) Includes Optik TV and TELUS Satellite TV subscribers.
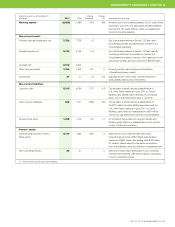
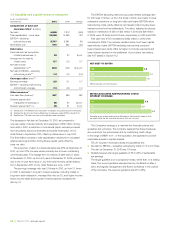
Wireless segment total operating expenses increased by $214 million
in 2010 when compared to 2009.
.Equipment sales expenses increased by $170 million in 2010 when
compared to 2009. The increase was primarily due to higher acquisi-
tion and retention volumes, as well as higher per-unit costs to support
increased smartphone loading for both new client acquisitions and
the migration of existing clients, notably including a higher proportion
of upgrades to Apple iPhones and RIM BlackBerrys. In 2010, this
category also includes full-year results from Black’s Photo, acquired
in September 2009.
.Network operating expenses increased by $19 million or 3.1% in 2010
when compared to 2009, which reflects increasing network efficiency
as indicated by network revenue growth of 5.0%. The increase in
network expense reflects growth in roaming volumes, slightly higher
revenue-share and licensing costs, and the introduction of regulated
e911 fees for wireless subscribers in Quebec, partly offset by lower
roaming costs from reduced rates. Lower negotiated revenue-share
and licensing rates were more than offset by increases in revenue-
share volumes to third parties and licensing volumes to service
providers as a result of the continued penetration of smartphones.
.Marketing expenses increased by $18 million in 2010 when compared
to 2009, principally due to higher commissions related to higher
volumes, partly offset by lower advertising expenses in 2010 due
to the initial launch of the HSPA+ network in November 2009.
COA per gross subscriber addition increased by $13 or 3.9% in
2010, when compared to 2009, due to higher per-unit subsidy costs
driven by a higher smartphone mix, and to a lesser extent higher
commissions to support an increasing number of higher-value smart-
phone devices. This was partly offset by a favourable U.S. dollar
exchange rate compared to 2009, higher advertising and promotion
expenditures in the fourth quarter of 2009 to support the HSPA+
network launch, and increased gross additions in 2010 creating
improved efficiency of advertising and promotion expenditures per
gross addition.
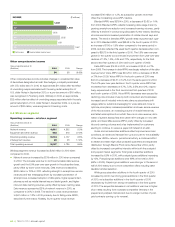
Retention costs as a percentage of network revenue increased
to 11.6% in 2010, as compared to 10.9% in 2009. The retention
cost ratio increased due to higher retention volumes related to
a larger subscriber base and a significantly larger volume of clients
migrating to smartphones, typically upgrades to HSPA devices,
partly offset by improving network revenue growth, lower commissions
per retention subscriber and a favourable U.S. dollar exchange
rate compared to 2009.
.Total G&A expenses increased by only $15 million, or 1.7%, in 2010
when compared to 2009, reflecting improved efficiency in supporting
the subscriber base, which grew by 6.9%.
Salaries, benefits and employee-related costs increased by
$15 million year-over-year, as higher 2010 performance bonus accruals
due to improved financial and operating results and inclusion of
a full year of Black’s Photo expenses in 2010 were partly offset by
reductions in domestic FTE employees. Other G&A expenses were
unchanged year-over-year, as inclusion of a full year of expenses
from Black’s Photo and increased external labour costs to support
the growing subscriber base were offset by lower bad debt expenses
and supplemented by one-time operating savings in the first quarter
of 2010. Bad debt expense decreased by $25 million, reflecting lower
involuntary subscriber churn from an improved economy.
.Restructuring costs decreased by $8 million in 2010 when compared
to 2009. See discussion in Section 5.3.