Telus 2010 Annual Report Download - page 39
Download and view the complete annual report
Please find page 39 of the 2010 Telus annual report below. You can navigate through the pages in the report by either clicking on the pages listed below, or by using the keyword search tool below to find specific information within the annual report.-
 1
1 -
2
-
3
-
4
-
5
-
6
-
7
-
8
-
9
-
10
-
11
-
12
-
13
-
14
-
15
-
16
-
17
-
18
-
19
-
20
-
21
-
22
-
23
-
24
-
25
-
26
-
27
-
28
-
 29
29 -
 30
30 -
 31
31 -
 32
32 -
 33
33 -
 34
34 -
 35
35 -
 36
36 -
 37
37 -
 38
38 -
 39
39 -
 40
40 -
 41
41 -
 42
42 -
 43
43 -
 44
44 -
 45
45 -
 46
46 -
 47
47 -
 48
48 -
 49
49 -
50
-
51
-
52
-
53
-
54
-
55
-
56
-
57
-
58
-
59
-
60
-
61
-
62
-
63
-
64
-
65
-
66
-
67
-
68
-
69
-
70
-
71
-
72
-
73
-
74
-
75
-
76
-
77
-
78
-
79
-
80
-
81
-
82
-
83
-
84
-
85
-
86
-
87
-
88
-
89
-
90
-
91
-
92
-
93
-
94
-
95
-
96
-
97
-
98
-
99
-
100
-
101
-
102
-
103
-
104
-
105
-
106
-
107
-
108
-
109
-
110
-
111
-
112
-
113
-
114
-
115
-
116
-
117
-
118
-
119
-
120
-
121
-
122
-
123
-
124
-
125
-
126
-
127
-
128
-
129
-
130
-
131
-
132
-
133
-
134
-
135
-
136
-
137
-
138
-
139
-
140
-
141
-
142
-
143
-
144
-
145
-
146
-
147
-
148
-
149
-
150
-
151
-
152
-
153
-
154
-
155
-
156
-
157
-
158
-
159
-
160
-
161
-
162
-
163
-
164
-
165
-
166
-
167
-
168
-
169
-
170
-
171
-
172
-
173
-
174
-
175
-
176
-
177
-
178
-
179
-
180
-
181
-
182
 |
 |

TELUS 2010 annual report . 35
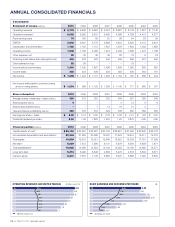
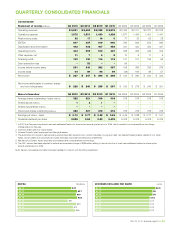
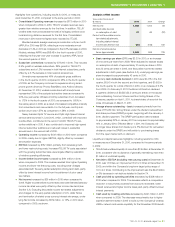
QUARTERLY OPERATING STATISTICS
Consolidated
Q4 2010 Q3 2010 Q2 2010 Q1 2010 Q4 2009 Q3 2009 Q2 2009 Q1 2009
Cash flow statement information
Cash provided by operating activities (millions) $ß 696 $ß 913 $ß 523 $ß 414 $ 624 $ 814 $ 852 $ 614
Cash used by investing activities (millions) (559) (452) (389) (307) (513) (585) (552) (478)
Cash used by financing activities (millions) (170) (452) (139) (102) (104) (221) (339) (75)
Profitability ratios
Dividend payout1 65% 66% 64% 64% 61% 53% 53% 52%
Return on common equity2 13.1% 12.3% 13.0% 12.5% 13.4% 15.3% 15.7% 16.2%
Return on assets3 13.0% 12.8% 12.5% 14.2% 15.1% 15.7% 16.8% 14.7%
Debt and coverage ratios
EBITDA interest coverage ratio4 7.3 5.8 6.7 6.7 6.9 9.0 8.7 8.5
Net debt to EBITDA ratio5 1.8 1.9 1.9 2.0 2.0 1.9 1.9 1.9
Net debt to total capitalization 45.5% 46.0% 47.6% 48.2% 48.9% 48.4% 49.1% 49.6%
Other metrics
Free cash flow (millions)6 $ß 121 $ß 339 $ß 241 $ß 246 $ß (50) $ 266 $ 144 $ 125
Capital expenditures (millions) $ß 564 $ß 449 $ß 397 $ß 311 $ 514 $ 558 $ 557 $ 474
Payment for wireless spectrum (millions) $ß – $ß – $ß – $ß – $ – $ – $ – $ –
Capex intensity7 22% 18% 17% 13% 21% 23% 23% 20%
Capex intensity7 including payment
for wireless spectrum 22% 18% 17% 13% 21% 23% 23% 20%
Total customer connections (000s)8 12,253 12,129 11,979 11,893 11,875 11,782 11,691 11,617
Employee-related information
Total salaries and benefits (millions) $ß 555 $ß 563 $ß 561 $ß 554 $ 583 $ 562 $ 590 $ 568
n.m. – not meaningful
1 Last quarterly dividend declared per share, in the respective reporting period, annualized, divided by the sum of Basic earnings per share reported in the most
recent four quarters.
2 Common share and non-voting share income over the average quarterly common equity for the 12-month period. Quarterly ratios are calculated on a 12-month
trailing basis.
3 Cash provided by operating activities divided by total assets. Quarterly ratios are based on a 12-month trailing cash flow provided by operating activities.
4 EBITDA excluding Restructuring costs, divided by Financing costs before gains on redemption and repayment of debt, calculated on a 12-month trailing basis.
This ratio, adjusted to exclude the loss on redemption of long-term debt, was 7.8 in the fourth quarter of 2010 and 8.5 in the fourth quarter of 2009.
5 Net debt at the end of the period divided by 12-month trailing EBITDA excluding Restructuring costs.
6 EBITDA as reported, deducting donations expense and securitization fees, adjusted for payments in excess of expense for share-based compensation, restructuring
activities and defined benefit plans, and deducting cash interest, cash income tax, capital expenditures, payment for wireless spectrum, and before dividends.
7 Capital expenditures divided by Operating revenues.
8
The measure is a sum of wireless subscribers, network access lines, Internet access subscribers and TV subscribers (TELUS Optik TV and TELUS Satellite TV).
Historical Network access lines updated for prior periods commencing in 2007.
9 Includes net-cash settlement feature expenses of $169 million in 2007.
10 Excluding employees in TELUS International, total active employees were 26,400 in 2010, 27,700 in 2009, 28,700 in 2008, 27,500 in 2007, 27,100 in 2006, 26,500 in 2005
and 25,800 in 2004. In 2009, TELUS acquired Black’s Photo, which added 1,250 total employees.
11 The measure of FTE employees is not reported for fiscal year 2005, as it does not factor in effective overtime hours on staff equivalents because of the labour disruption.
12 EBITDA excluding Restructuring costs, divided by average FTE employees. For 2007, EBITDA excluded the net-cash settlement feature expense of $169 million.
Note: Certain comparative information has been restated to conform with the 2010 presentation.
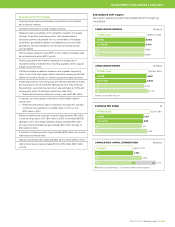
397
449
474
558
557
514
564
311
CAPITAL EXPENDITURES ($ millions)
Q4 10
Q3 10
Q2 10
Q1 10
Q4 09
Q3 09
Q2 09
Q1 09
12.0
12.1
11.6
11.8
11.7
11.9
12.3
11.9
TOTAL CUSTOMER CONNECTIONS (millions)
wireless wireline
Q4 10
Q3 10
Q2 10
Q1 10
Q4 09
Q3 09
Q2 09
Q1 09