Telus 2010 Annual Report Download - page 169
Download and view the complete annual report
Please find page 169 of the 2010 Telus annual report below. You can navigate through the pages in the report by either clicking on the pages listed below, or by using the keyword search tool below to find specific information within the annual report.-
 1
1 -
2
-
3
-
4
-
5
-
6
-
7
-
8
-
9
-
10
-
11
-
12
-
13
-
14
-
15
-
16
-
17
-
18
-
19
-
20
-
21
-
22
-
23
-
24
-
25
-
26
-
27
-
28
-
29
-
30
-
31
-
32
-
33
-
34
-
35
-
36
-
37
-
38
-
39
-
40
-
41
-
42
-
43
-
44
-
45
-
46
-
47
-
48
-
49
-
50
-
51
-
52
-
53
-
54
-
55
-
56
-
57
-
58
-
59
-
60
-
61
-
62
-
63
-
64
-
65
-
66
-
67
-
68
-
69
-
70
-
71
-
72
-
73
-
74
-
75
-
76
-
77
-
78
-
79
-
80
-
81
-
82
-
83
-
84
-
85
-
86
-
87
-
88
-
89
-
90
-
91
-
92
-
93
-
94
-
95
-
96
-
97
-
98
-
99
-
100
-
101
-
102
-
103
-
104
-
105
-
106
-
107
-
108
-
109
-
110
-
111
-
112
-
113
-
114
-
115
-
116
-
117
-
118
-
119
-
120
-
121
-
122
-
123
-
124
-
125
-
126
-
127
-
128
-
129
-
130
-
131
-
132
-
133
-
134
-
135
-
136
-
137
-
138
-
139
-
140
-
141
-
142
-
143
-
144
-
145
-
146
-
147
-
148
-
149
-
150
-
151
-
152
-
153
-
154
-
155
-
156
-
157
-
158
-
 159
159 -
 160
160 -
 161
161 -
 162
162 -
 163
163 -
 164
164 -
 165
165 -
 166
166 -
 167
167 -
 168
168 -
 169
169 -
 170
170 -
 171
171 -
 172
172 -
 173
173 -
 174
174 -
 175
175 -
 176
176 -
 177
177 -
 178
178 -
 179
179 -
180
-
181
-
182
 |
 |

TELUS 2010 annual report . 165
FINANCIAL STATEMENTS & NOTES: 22–23
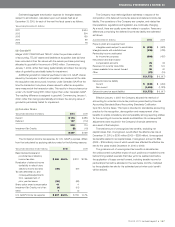
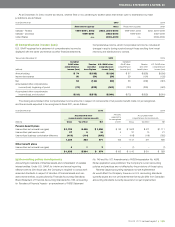
The following is an analysis of retained earnings reflecting the
application of U.S. GAAP:
Years ended December 31 (millions) 2010 2009
Balance at beginning of period $ 553 $ 227
Net income in accordance with U.S. GAAP
attributable to Common Shares
and Non-Voting Shares 958 927
1,511 1,154
Dividends (642) (601)
Balance at end of period $ 869 $ 553
The following is an analysis of major statement of financial position
categories reflecting the application of U.S. GAAP:
As at December 31 (millions) 2010 2009
Current Assets $ß 1,390 $ß 1,127
Non-Current Assets
Property, plant and equipment 7,722 7,729
Intangible assets 6,541 6,605
Goodwill 3,974 3,974
Other assets 310 362
18,547 18,670
$ß19,937 $ß19,797
Current Liabilities $ß 3,950 $ß 2,964
Non-Current Liabilities
Long-term debt 5,340 6,120
Other long-term liabilities 838 1,413
Deferred income taxes 1,424 1,323
7,602 8,856
Total Liabilities 11,552 11,820
Owners’ Equity
Common Share and Non-Voting
Share equity 8,363 7,956
Non-controlling interests 22 21
8,385 7,977
$ß19,937 $ß19,797
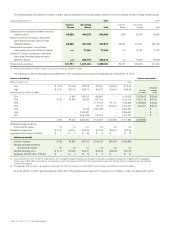
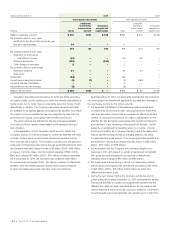
Significant differences between Canadian GAAP and U.S. GAAP
would have the following effect on reported net income of the Company:
Years ended December 31
(millions except per share amounts) 2010 2009
Net income in accordance
with Canadian GAAP $ß1,038 $ß1,002
Adjustments:
Operating expenses
Operations (b) (57) (65)
Amortization of intangible assets (c) (50) (50)
Taxes on the above adjustments
and tax rate changes (e) 31 44
Net income in accordance with U.S. GAAP 962 931
Other comprehensive income (loss),
net of taxes (f)
In accordance with Canadian GAAP 54 58
Change in pension related other
comprehensive income accounts (144) (439)
In accordance with U.S. GAAP (90) (381)
Comprehensive income in
accordance with U.S. GAAP $ 872 $ 550
Net income in accordance with U.S. GAAP
attributable to:
Common Shares and Non-Voting Shares $ 958 $ 927
Non-controlling interests 4 4
$ 962 $ 931
Comprehensive income in accordance
with U.S. GAAP attributable to:
Common Shares and Non-Voting Shares $ 868 $ 546
Non-controlling interests 4 4
$ 872 $ 550
Net income in accordance with U.S. GAAP
per Common Share and Non-Voting Share
Basic $ß 2.99 $ß 2.92
Diluted $ß 2.98 $ß 2.91
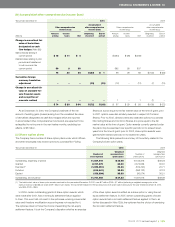
The following is a reconciliation of Common Share and Non-Voting Share equity incorporating the significant differences between Canadian
and U.S. GAAP:
Common Share and Non-Voting Share equity
Accumulated
other
Common Non-Voting Contributed Retained comprehensive
As at December 31, 2010 (millions) Shares Shares surplus earnings income (loss) Total
Under Canadian GAAP $ß2,219 $ß3,237 $ß190 $ß2,551 $ß (18) $ß8,179
Adjustments:
Merger of BC TELECOM and TELUS (a), (c), (d) 1,733 883 – (1,582) (973) 61
Share-based compensation (b) 10 60 26 (96) – –
Acquisition of Clearnet Communications Inc.
Goodwill (d) – 131 – (8) – 123
Convertible debentures – (3) (1) 4 – –
Under U.S. GAAP $ß3,962 $ß4,308 $ß215 $ 869 $ß(991) $ß8,363