Telus 2010 Annual Report Download - page 139
Download and view the complete annual report
Please find page 139 of the 2010 Telus annual report below. You can navigate through the pages in the report by either clicking on the pages listed below, or by using the keyword search tool below to find specific information within the annual report.-
 1
1 -
2
-
3
-
4
-
5
-
6
-
7
-
8
-
9
-
10
-
11
-
12
-
13
-
14
-
15
-
16
-
17
-
18
-
19
-
20
-
21
-
22
-
23
-
24
-
25
-
26
-
27
-
28
-
29
-
30
-
31
-
32
-
33
-
34
-
35
-
36
-
37
-
38
-
39
-
40
-
41
-
42
-
43
-
44
-
45
-
46
-
47
-
48
-
49
-
50
-
51
-
52
-
53
-
54
-
55
-
56
-
57
-
58
-
59
-
60
-
61
-
62
-
63
-
64
-
65
-
66
-
67
-
68
-
69
-
70
-
71
-
72
-
73
-
74
-
75
-
76
-
77
-
78
-
79
-
80
-
81
-
82
-
83
-
84
-
85
-
86
-
87
-
88
-
89
-
90
-
91
-
92
-
93
-
94
-
95
-
96
-
97
-
98
-
99
-
100
-
101
-
102
-
103
-
104
-
105
-
106
-
107
-
108
-
109
-
110
-
111
-
112
-
113
-
114
-
115
-
116
-
117
-
118
-
119
-
120
-
121
-
122
-
123
-
124
-
125
-
126
-
127
-
128
-
 129
129 -
 130
130 -
 131
131 -
 132
132 -
 133
133 -
 134
134 -
 135
135 -
 136
136 -
 137
137 -
 138
138 -
 139
139 -
 140
140 -
 141
141 -
 142
142 -
 143
143 -
 144
144 -
 145
145 -
 146
146 -
 147
147 -
 148
148 -
 149
149 -
150
-
151
-
152
-
153
-
154
-
155
-
156
-
157
-
158
-
159
-
160
-
161
-
162
-
163
-
164
-
165
-
166
-
167
-
168
-
169
-
170
-
171
-
172
-
173
-
174
-
175
-
176
-
177
-
178
-
179
-
180
-
181
-
182
 |
 |
TELUS 2010 annual report . 135
FINANCIAL STATEMENTS & NOTES: 5
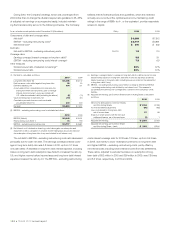
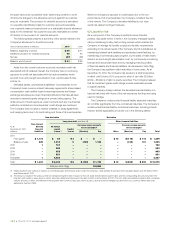
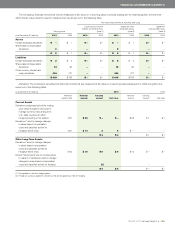
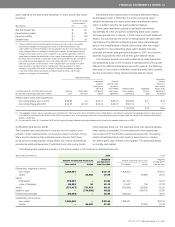
The Company’s financial instruments that are measured at fair value on a recurring basis in periods subsequent to initial recognition and the level
within the fair value hierarchy used to measure them are as set out in the following table.
Fair value measurements at reporting date using
Quoted prices in active Significant other Significant
markets for identical items observable inputs unobservable inputs
Carrying value (Level 1) (Level 2) (Level 3)
As at December 31 (millions) 2010 2009 2010 2009 2010 2009 2010 2009
Assets
Foreign exchange derivatives $ß – $ß 1 $ß– $ß– $ß – $ß 1 $ß– $ß–
Share-based compensation
derivatives 9 – – – 9 – – –
$ß 9 $ß 1 $ß– $ß– $ß 9 $ß 1 $ß– $ß–
Liabilities
Foreign exchange derivatives $ß 2 $ß 2 $ß– $ß– $ß 2 $ß 2 $ß– $ß–
Share-based compensation
derivatives 13 60 – – 13 60 – –
Cross currency interest rate
swap derivatives 404 721 – – 404 721 – –
$ß419 $ß783 $ß– $ß– $ß419 $ß783 $ß– $ß–
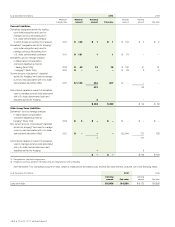
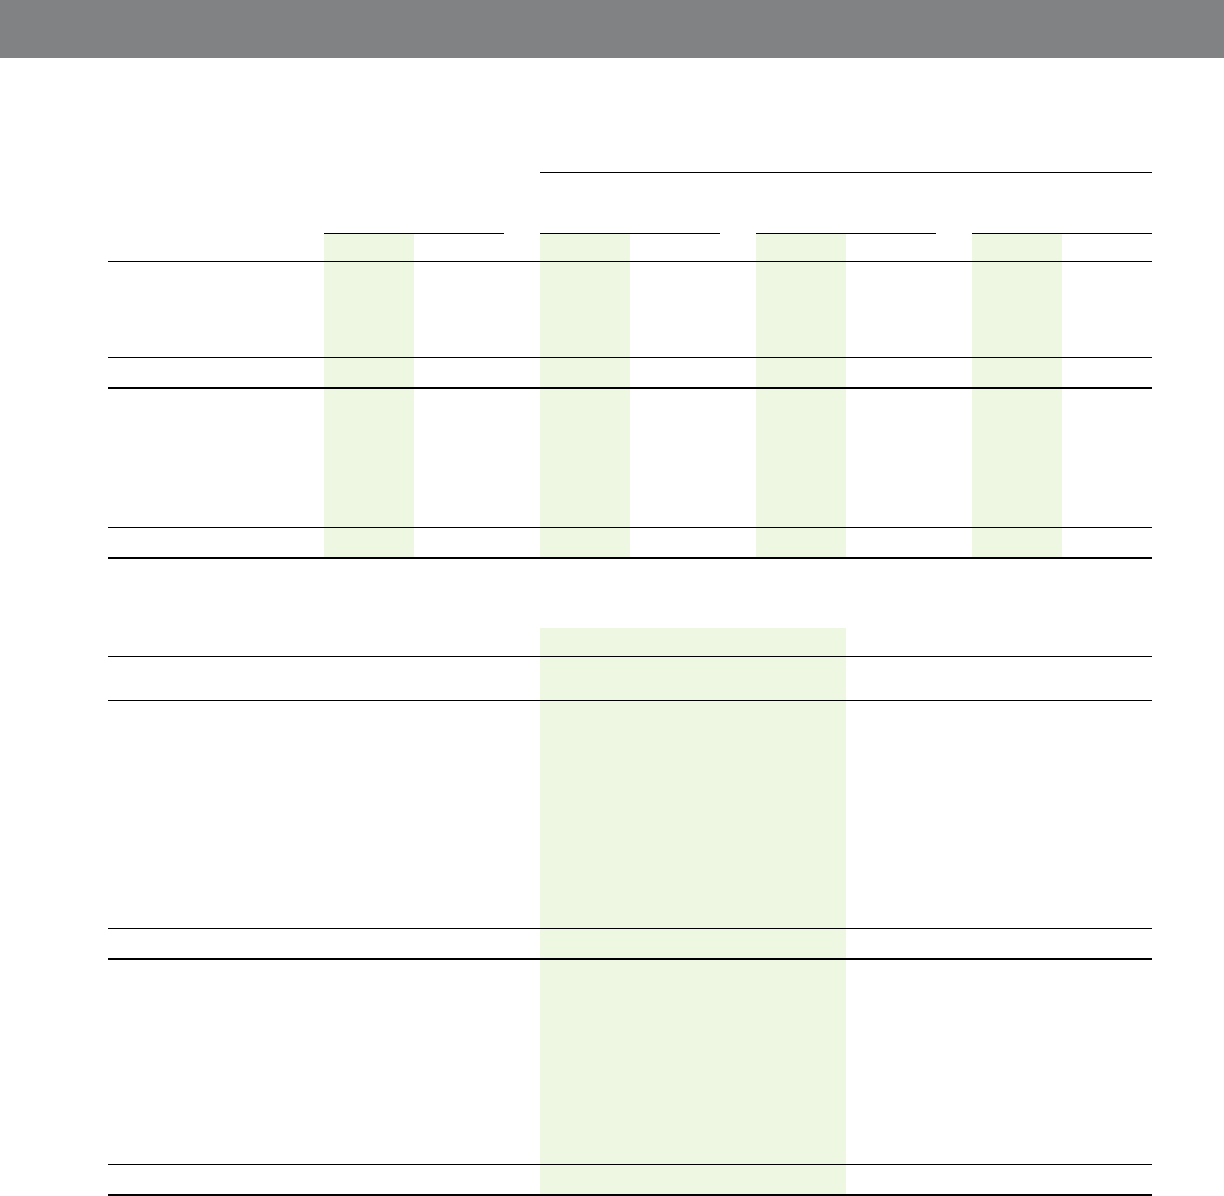
Derivative: The Company’s derivative financial instruments that are measured at fair value on a recurring basis subsequent to initial recognition are
as set out in the following table.
As at December 31 (millions) 2010 2009
Maximum Notional Carrying Notional Carrying
maturity date amount amount Fair value amount amount Fair value
Current Assets
Derivatives designated as held for trading
upon initial recognition and used to
manage currency risks arising from
U.S. dollar revenues to which
hedge accounting is not applied 2 0 11 $ß48 $ ß– $ ß– $ß23 $ß1 $ß1
Derivatives(1) used to manage changes
in share-based compensation
costs and classified as held for
hedging(2) (Note 12(c)) 2 011 $ß14 4 4 $ß – – –
$ß4 $ß4 $ß1 $ß1
Other Long-Term Assets
Derivatives(1) used to manage changes
in share-based compensation
costs and classified as held for
hedging(2) (Note 12(c)) 2012 $ß15 $ß5 $ß4 $ß12 $ß– $ß–
Deduct: Net amounts due to counterparties
in respect of derivatives used to manage
changes in share-based compensation
costs and classified as held for hedging (1) –
$ß4 $ß4 $ß– $ß–
(1) Designated as cash flow hedging items.
(2) Hedge accounting is applied to derivatives that are designated as held for hedging.