Telus 2010 Annual Report Download - page 40
Download and view the complete annual report
Please find page 40 of the 2010 Telus annual report below. You can navigate through the pages in the report by either clicking on the pages listed below, or by using the keyword search tool below to find specific information within the annual report.-
 1
1 -
2
-
3
-
4
-
5
-
6
-
7
-
8
-
9
-
10
-
11
-
12
-
13
-
14
-
15
-
16
-
17
-
18
-
19
-
20
-
21
-
22
-
23
-
24
-
25
-
26
-
27
-
28
-
29
-
 30
30 -
 31
31 -
 32
32 -
 33
33 -
 34
34 -
 35
35 -
 36
36 -
 37
37 -
 38
38 -
 39
39 -
 40
40 -
 41
41 -
 42
42 -
 43
43 -
 44
44 -
 45
45 -
 46
46 -
 47
47 -
 48
48 -
 49
49 -
 50
50 -
51
-
52
-
53
-
54
-
55
-
56
-
57
-
58
-
59
-
60
-
61
-
62
-
63
-
64
-
65
-
66
-
67
-
68
-
69
-
70
-
71
-
72
-
73
-
74
-
75
-
76
-
77
-
78
-
79
-
80
-
81
-
82
-
83
-
84
-
85
-
86
-
87
-
88
-
89
-
90
-
91
-
92
-
93
-
94
-
95
-
96
-
97
-
98
-
99
-
100
-
101
-
102
-
103
-
104
-
105
-
106
-
107
-
108
-
109
-
110
-
111
-
112
-
113
-
114
-
115
-
116
-
117
-
118
-
119
-
120
-
121
-
122
-
123
-
124
-
125
-
126
-
127
-
128
-
129
-
130
-
131
-
132
-
133
-
134
-
135
-
136
-
137
-
138
-
139
-
140
-
141
-
142
-
143
-
144
-
145
-
146
-
147
-
148
-
149
-
150
-
151
-
152
-
153
-
154
-
155
-
156
-
157
-
158
-
159
-
160
-
161
-
162
-
163
-
164
-
165
-
166
-
167
-
168
-
169
-
170
-
171
-
172
-
173
-
174
-
175
-
176
-
177
-
178
-
179
-
180
-
181
-
182
 |
 |

36 . TELUS 2010 annual report
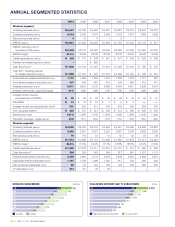
6.5
7.0
3.4
5.1
4.5
5.6
6.1
5.3
5.7
2.8
4.1
3.7
4.5
4.9
WIRELESS SUBSCRIBERS (millions)
10
09
08
07
06
05
04 3.9
3.2
04
03
postpaid prepaid
ANNUAL SEGMENTED STATISTICS
2010 2009 2008 2007 2006 2005 2004 2003
Wireless segment
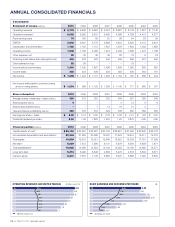
Operating revenues (millions) $ß5,047 $ß4,735 $ß4,660 $ß4,291 $ß3,881 $ß3,319 $ß2,833 $ß2,375
Operations expense (millions)1 3,012 2,790 2,647 2,384 2,122 1,874 1,689 1,558
Restructuring costs (millions) 4 12 8 1 6 – – –
EBITDA (millions) $ß2,031 $ß1,933 $ß2,005 $ß1,906 $ß1,753 $ß1,445 $ß1,144 $ 817
EBITDA2 excluding cost of
acquisition (COA) (millions) $ß2,629 $ß2,472 $ß2,587 $ß2,495 $ß2,286 $ß1,939 $ß1,580 $ß1,242
EBITDA margin2 40.2% 40.8% 43.0% 45.0% 45.2% 43.5% 40.4% 34.4%
Capital expenditures (millions) $ 463 $ 770 $ 548 $ 551 $ 427 $ 405 $ 355 $ 360
Payment for wireless spectrum (millions) – – $ 882 – – – – –
Cash flow (millions)2,3 $ß1,568 $ß1,163 $ß1,457 $ß1,379 $ß1,326 $ß1,040 $ 789 $ 457
Cash flow2,3 including payment
for wireless spectrum (millions) $ß1,568 $ß1,163 $ 575 $ß1,379 $ß1,326 $ß1,040 $ 789 $ 457
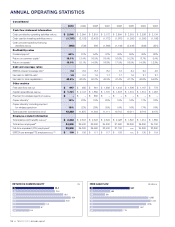
Gross additions wireless subscribers (000s) 1,710 1,599 1,655 1,434 1,293 1,279 1,121 987
Net additions wireless subscribers (000s)4 447 406 561 515 535 584 512 431
Wireless subscribers (000s)4,5 6,971 6,524 6,129 5,568 5,056 4,521 3,936 3,424
Wireless market share, subscriber-based 27% 28% 28% 27% 27% 27% 26% 26%
Average monthly revenue
per subscriber unit (ARPU) $ 58 $ 58 $ 63 $ 64 $ 63 $ 62 $ 60 $ 57
Data ARPU $ 14 $ 12 $ 10 $ 7 $ 5 $ 3 n.a. n.a.
Average minutes per subscriber per month 361 392 411 404 403 399 384 350
COA, per gross addition $ 350 $ 337 $ 351 $ 395 $ 412 $ 386 $ 389 $ 430
Monthly churn rate4 1.57% 1.58% 1.57% 1.45% 1.33% 1.39% 1.40% 1.46%
Population coverage – digital (millions)6 33.8 33.1 32.6 31.6 31.0 30.6 30.0 29.5
Wireline segment
Operating revenues (millions) $ß4,920 $ß5,033 $ß5,152 $ß4,924 $ß4,921 $ß4,938 $ß4,866 $ß4,881
Operations expense (millions)1 3,238 3,297 3,327 3,222 2,997 3,009 2,842 2,829
Restructuring costs (millions) 70 178 51 19 62 54 53 28
EBITDA (millions) $ß1,612 $ß1,558 $ß1,774 $ß1,683 $ß1,862 $ß1,875 $ß1,971 $ß2,024
EBITDA margin2 32.8% 31.0% 34.4% 37.1% 37.8% 38.0% 40.5% 41.5%
Capital expenditures (millions) $ß1,258 $ß1,333 $ß1,311 $ß1,219 $ß1,191 $ 914 $ 964 $ 893
Cash flow (millions)2,3 354 225 463 609 671 961 1,007 1,131
Network access lines in service (000s)7 3,739 3,966 4,176 4,333 4,548 4,691 4,808 4,870
High-speed Internet subscribers (000s)8 1,167 1,128 1,096 1,020 917 763 690 562
Dial-up Internet subscribers (000s) 62 87 124 155 194 236 282 320
TV subscribers (000s)9 314 170 78 35 – – – –
1,298
1,481
690
917
763
1,055
1,174
HIGH-SPEED INTERNET AND TV SUBSCRIBERS (000s)
high-speed Internet subscribers TV subscribers
10
09
08
07
06
05
04
562
03
1,128
1,167
1,020
1,096