Telus 2010 Annual Report Download - page 65
Download and view the complete annual report
Please find page 65 of the 2010 Telus annual report below. You can navigate through the pages in the report by either clicking on the pages listed below, or by using the keyword search tool below to find specific information within the annual report.-
 1
1 -
2
-
3
-
4
-
5
-
6
-
7
-
8
-
9
-
10
-
11
-
12
-
13
-
14
-
15
-
16
-
17
-
18
-
19
-
20
-
21
-
22
-
23
-
24
-
25
-
26
-
27
-
28
-
29
-
30
-
31
-
32
-
33
-
34
-
35
-
36
-
37
-
38
-
39
-
40
-
41
-
42
-
43
-
44
-
45
-
46
-
47
-
48
-
49
-
50
-
51
-
52
-
53
-
54
-
 55
55 -
 56
56 -
 57
57 -
 58
58 -
 59
59 -
 60
60 -
 61
61 -
 62
62 -
 63
63 -
 64
64 -
 65
65 -
 66
66 -
 67
67 -
 68
68 -
 69
69 -
 70
70 -
 71
71 -
 72
72 -
 73
73 -
 74
74 -
 75
75 -
76
-
77
-
78
-
79
-
80
-
81
-
82
-
83
-
84
-
85
-
86
-
87
-
88
-
89
-
90
-
91
-
92
-
93
-
94
-
95
-
96
-
97
-
98
-
99
-
100
-
101
-
102
-
103
-
104
-
105
-
106
-
107
-
108
-
109
-
110
-
111
-
112
-
113
-
114
-
115
-
116
-
117
-
118
-
119
-
120
-
121
-
122
-
123
-
124
-
125
-
126
-
127
-
128
-
129
-
130
-
131
-
132
-
133
-
134
-
135
-
136
-
137
-
138
-
139
-
140
-
141
-
142
-
143
-
144
-
145
-
146
-
147
-
148
-
149
-
150
-
151
-
152
-
153
-
154
-
155
-
156
-
157
-
158
-
159
-
160
-
161
-
162
-
163
-
164
-
165
-
166
-
167
-
168
-
169
-
170
-
171
-
172
-
173
-
174
-
175
-
176
-
177
-
178
-
179
-
180
-
181
-
182
 |
 |

TELUS 2010 annual report . 61
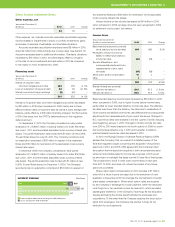
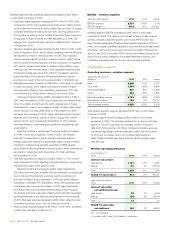
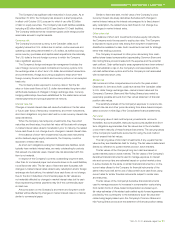
Wireless operating indicators
As at December 31 2010 2009 Change
Subscribers (000s)
Postpaid 5,705 5,290 7.8%
Prepaid 1,266 1,234 2.6%
To t a l 6,971 6,524 6.9%
Proportion of subscriber base
that is postpaid (%) 81.8 81.1 0.7 pts.
Digital POP(1) coverage (millions)(2) 33.8 33.1 2.1%
HSPA+ POP coverage (millions)(2) 33.1 31 ~ 6.7%
Years ended December 31 2010 2009 Change
Subscriber gross additions (000s)
Postpaid 1,160 1,036 12.0%
Prepaid 550 563 (2.3)%
To t a l 1,710 1,599 6.9%
Subscriber net additions (000s)
Postpaid 415 379 9.5%
Prepaid 32 27 18.5%
To t a l 447 406 10.1%
ARPU(3) ($) 57.64 58.46 (1.4)%
Churn, per month(3) (%) 1.57 1.58 (0.01) pts.
Average monthly minutes of
use per subscriber (MOU) 361 392 (7.9)%
COA(4) per gross
subscriber addition(3) ($) 350 337 3.9%
Retention spend to
network revenue(3) (%) 11.6 10.9 0.7 pts.
EBITDA to network revenue (%) 44.0 44.0 –
(1) POP is an abbreviation for population. A POP refers to one person living in
a population area that is wholly or substantially included in the coverage area.
(2) Including roaming/resale and network-sharing agreements, principally with
Bell Canada.
(3) See Section 11.3 Definitions of key wireless operating indicators. These are industry
measures useful in assessing operating performance of a wireless company,
but are not measures defined under Canadian or U.S. GAAP.
(4) Cost of acquisition.
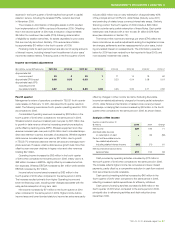
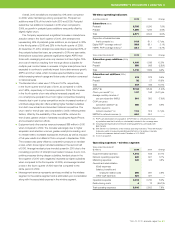
Operating expenses – wireless segment
Years ended December 31
($ millions) 2010 2009 Change
Equipment sales expenses 1,015 845 20.1%
Network operating expenses 640 621 3.1%
Marketing expenses 440 422 4.3%
General and administration
(G&A) expenses
Salaries, benefits and
employee-related costs 596 581 2.6%
Other G&A expenses 321 321 –
Operations expense 3,012 2,790 8.0%
Restructuring costs 4 12 (66.7)%
Total operating expenses 3,016 2,802 7.6%
MANAGEMENT’S DISCUSSION & ANALYSIS: 5
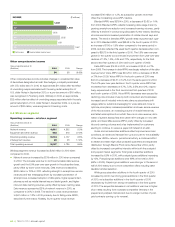
Overall, 2010 net additions increased by 10% when compared
to 2009, while maintaining a strong postpaid mix. Postpaid net
additions were 93% of the total in both 2010 and 2009. Postpaid
subscriber net additions increased in 2010 when compared to
2009, as growth in postpaid gross additions was partly offset by
slightly higher churn.
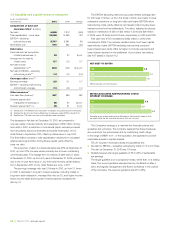
The Company experienced a significant increase in smartphone
adoption rates in the fourth quarter of 2010, with smartphones
representing 46% of postpaid gross additions, as compared to 38%
in the third quarter of 2010 and 25% in the fourth quarter of 2009.
At December 31, 2010, smartphone subscribers represented 33% of
the postpaid subscriber base, as compared to 20% one year earlier.
Smartphone subscribers generate significantly higher ARPU than
those with messaging and voice-only devices, but have higher COA
and cost of retention resulting from the large device subsidies for
multiple-year contract sales or renewals. A higher smartphone mix is
expected to continue to positively impact future data revenue growth,
ARPU and churn rates, which increase expected lifetime revenue,
while increasing network usage and future costs of retention compared
to historical levels.
.The blended churn rates were 1.72% and 1.57%, respectively,
in the fourth quarter and full year of 2010, as compared to 1.60%
and 1.58%, respectively, in the same periods in 2009. The increase
in the fourth quarter churn rate reflects increased prepaid and
non-smartphone postpaid churn from higher competitive marketing
intensity due in part to price competition and an increased number
of
unlimited-usage rate plan offers entailing higher handset subsidies
from both new entrants and incumbent national competitors. The
churn rate for the full year was comparable to 2009, reflecting these
factors, offset by the availability of the new HSPA+ network for
the full year, greater choice in handsets including the Apple iPhone,
and successful retention efforts.
.Equipment and other service revenue increased $88 million in 2010
when compared to 2009. The increase was largely due to higher
acquisition and retention volumes, greater smartphone loading, and
to a lesser extent, increased accessories revenues, as well as inclusion
of full-year results from Black’s Photo, acquired in September 2009.
The increase was partly offset by competitive pressure on handset
prices, which drove higher handset subsidies in the second half
of 2010. Average handset prices trended upward in 2010 due to the
increasing proportion of smartphones loaded, however, due to com-
petitive pressures driving deeper subsidies, handset prices in the
third quarter of 2010 were negatively impacted by higher subsidies
when compared to the third quarter of 2009, and average handset
prices in the fourth quarter of 2010 were flat compared to the
same period in 2009.
.Intersegment revenue represents services provided by the wireless
segment to the wireline segment and is eliminated upon consolidation
along with the associated expense in the wireline segment.