Telus 2010 Annual Report Download - page 69
Download and view the complete annual report
Please find page 69 of the 2010 Telus annual report below. You can navigate through the pages in the report by either clicking on the pages listed below, or by using the keyword search tool below to find specific information within the annual report.-
 1
1 -
2
-
3
-
4
-
5
-
6
-
7
-
8
-
9
-
10
-
11
-
12
-
13
-
14
-
15
-
16
-
17
-
18
-
19
-
20
-
21
-
22
-
23
-
24
-
25
-
26
-
27
-
28
-
29
-
30
-
31
-
32
-
33
-
34
-
35
-
36
-
37
-
38
-
39
-
40
-
41
-
42
-
43
-
44
-
45
-
46
-
47
-
48
-
49
-
50
-
51
-
52
-
53
-
54
-
55
-
56
-
57
-
58
-
 59
59 -
 60
60 -
 61
61 -
 62
62 -
 63
63 -
 64
64 -
 65
65 -
 66
66 -
 67
67 -
 68
68 -
 69
69 -
 70
70 -
 71
71 -
 72
72 -
 73
73 -
 74
74 -
 75
75 -
 76
76 -
 77
77 -
 78
78 -
 79
79 -
80
-
81
-
82
-
83
-
84
-
85
-
86
-
87
-
88
-
89
-
90
-
91
-
92
-
93
-
94
-
95
-
96
-
97
-
98
-
99
-
100
-
101
-
102
-
103
-
104
-
105
-
106
-
107
-
108
-
109
-
110
-
111
-
112
-
113
-
114
-
115
-
116
-
117
-
118
-
119
-
120
-
121
-
122
-
123
-
124
-
125
-
126
-
127
-
128
-
129
-
130
-
131
-
132
-
133
-
134
-
135
-
136
-
137
-
138
-
139
-
140
-
141
-
142
-
143
-
144
-
145
-
146
-
147
-
148
-
149
-
150
-
151
-
152
-
153
-
154
-
155
-
156
-
157
-
158
-
159
-
160
-
161
-
162
-
163
-
164
-
165
-
166
-
167
-
168
-
169
-
170
-
171
-
172
-
173
-
174
-
175
-
176
-
177
-
178
-
179
-
180
-
181
-
182
 |
 |

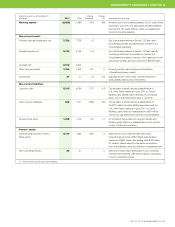
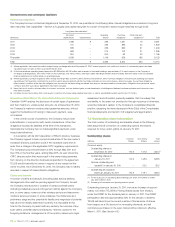
TELUS 2010 annual report . 65
MANAGEMENT’S DISCUSSION & ANALYSIS: 6
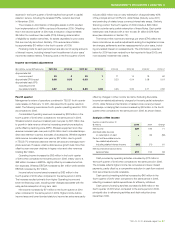
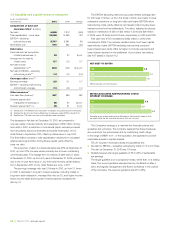
Financial position as at December 31 Change Change
($ millions) 2010 2009 ($ millions) (%) Explanation of the change
Working capital(1) (2,559) (1,837) (722) (39) Primarily due to the remaining balance of U.S. dollar Notes
maturing in June 2011 and associated derivative liabilities
(see Section 7.3), partly offset by higher receivables and
lower income taxes payable
Non-current assets
Property, plant and equipment, net 7,722 7,729 (7) – See Capital expenditures in Section 7.2 Cash used
by investing activities and Depreciation in Section 5.3
Consolidated operations
Intangible assets, net 5,134 5,148 (14) – See Capital expenditures in Section 7.2 Cash used by
investing activities and Amortization in Section 5.3
Consolidated operations. Included in the balances for both
periods are wireless spectrum licences of $3,849 million
Goodwill, net 3,572 3,572 – – –
Other long-term assets 1,744 1,602 142 9 Primarily pension plan funding and amortization
of transitional pension assets
Investments 37 41 (4) (10) Dispositions and write-downs of small investments
were partially offset by new investments
Non-current liabilities
Long-term debt 5,313 6,090 (777) (13) The decrease primarily reflects reclassification of
U.S. dollar Notes maturing in June 2011 to Current
liabilities, and a $363 million decrease in commercial
paper, net of a $1 billion Note issue in July 2010
Other long-term liabilities 638 1,271 (633) (50) The decrease primarily reflects reclassification of
the $721 million derivative liability associated with the
U.S. dollar Notes maturing in June 2011 to Current
liabilities, partly offset by reclassification of $81 million
of the price cap deferral account from Current liabilities
Future income taxes 1,498 1,319 179 14 An increase in future taxes on long-term assets and
liabilities partly offset by a reclassification to the Current
portion of future income taxes
Owners’ equity
Common Share and Non-Voting 8,179 7,554 625 8 Mainly Net income of $1,034 million and Other
Share equity compre hensive income of $54 million, less declared
dividends of $642 million, and adding back $150 million
for treasury shares issued for dividends reinvested in
Non-Voting Shares under the dividend re-investment plan
Non-controlling interests 22 21 1 5 Net income of $4 million attributable to non-controlling
interests less dividends of $3 million paid by a subsidiary
to a non-controlling interest
(1) Current assets subtracting Current liabilities.