Telus 2010 Annual Report Download - page 116
Download and view the complete annual report
Please find page 116 of the 2010 Telus annual report below. You can navigate through the pages in the report by either clicking on the pages listed below, or by using the keyword search tool below to find specific information within the annual report.-
 1
1 -
2
-
3
-
4
-
5
-
6
-
7
-
8
-
9
-
10
-
11
-
12
-
13
-
14
-
15
-
16
-
17
-
18
-
19
-
20
-
21
-
22
-
23
-
24
-
25
-
26
-
27
-
28
-
29
-
30
-
31
-
32
-
33
-
34
-
35
-
36
-
37
-
38
-
39
-
40
-
41
-
42
-
43
-
44
-
45
-
46
-
47
-
48
-
49
-
50
-
51
-
52
-
53
-
54
-
55
-
56
-
57
-
58
-
59
-
60
-
61
-
62
-
63
-
64
-
65
-
66
-
67
-
68
-
69
-
70
-
71
-
72
-
73
-
74
-
75
-
76
-
77
-
78
-
79
-
80
-
81
-
82
-
83
-
84
-
85
-
86
-
87
-
88
-
89
-
90
-
91
-
92
-
93
-
94
-
95
-
96
-
97
-
98
-
99
-
100
-
101
-
102
-
103
-
104
-
105
-
 106
106 -
 107
107 -
 108
108 -
 109
109 -
 110
110 -
 111
111 -
 112
112 -
 113
113 -
 114
114 -
 115
115 -
 116
116 -
 117
117 -
 118
118 -
 119
119 -
 120
120 -
 121
121 -
 122
122 -
 123
123 -
 124
124 -
 125
125 -
 126
126 -
127
-
128
-
129
-
130
-
131
-
132
-
133
-
134
-
135
-
136
-
137
-
138
-
139
-
140
-
141
-
142
-
143
-
144
-
145
-
146
-
147
-
148
-
149
-
150
-
151
-
152
-
153
-
154
-
155
-
156
-
157
-
158
-
159
-
160
-
161
-
162
-
163
-
164
-
165
-
166
-
167
-
168
-
169
-
170
-
171
-
172
-
173
-
174
-
175
-
176
-
177
-
178
-
179
-
180
-
181
-
182
 |
 |

112 . TELUS 2010 annual report
Net debt to EBITDA – excluding restructuring costs is defined
as Net debt as at the end of the period divided by the 12-month trailing
EBITDA – excluding restructuring costs. TELUS’ long-term guideline range
for Net debt to EBITDA is from 1.5 to 2.0 times. Historically, Net debt
to EBITDA – excluding restructuring costs is substantially the same as
the Leverage Ratio covenant in TELUS’ credit facilities.
Net debt to total capitalization provides a measure of the
proportion of debt used in the Company’s capital structure.
Net interest cost is defined as Financing costs before gains on
redemption and repayment of debt, calculated on a 12-month trailing
basis. No gains on redemption and repayment of debt were recorded
in the respective periods. Losses recorded on the redemption of long-
term debt are included in net interest cost. Net interest costs for the
years ended December 31, 2010 and 2009 are equivalent to Financing
costs reported for those periods, as currently reported and for
unaudited pro forma IFRS-IASB results.
Total capitalization – book value is calculated as Net debt plus
Owners’ equity, excluding accumulated other comprehensive income or
loss. The transition to IFRS results in differences in Owners’ equity from
the amounts currently reported.
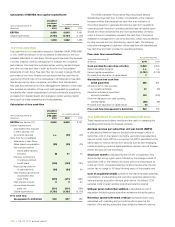
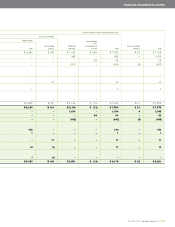
Calculation of total capitalization
Unaudited pro forma
IFRS-IASB As currently reported
Dec. 31, Jan. 1, Dec. 31, Dec. 31,
As at ($ millions) 2010 2010 2010 2009
Net debt 6,869 7,312 6,869 7,312
Owners’ equity
Common Share and Non-
Voting Share equity 7,759 7,334 8,179 7,554
Add back
Accumulated other
comprehensive loss 213 53 18 72
Non-controlling interests 22 21 22 21
Total capitalization
– book value 14,863 14,720 15,088 14,959
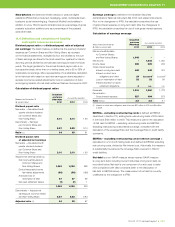
Calculation of Net debt
Unaudited pro forma
IFRS-IASB As currently reported
Dec. 31, Jan. 1, Dec. 31, Dec. 31,
As at ($ millions) 2010 2010 2010 2009
Long-term debt including
current portion 6,056 6,172 6,056 6,172
Debt issuance costs netted
against long-term debt 28 30 28 30
Derivative liability 404 721 404 721
Accumulated other compre-
hensive income amounts
arising from financial
instruments used to
manage interest rate and
currency risks associated
with U.S. dollar denomi-
nated debt (excluding
tax effects) (2) (70) (2) (70)
Cash and temporary
investments (17) (41) (17) (41)
Proceeds from securitized
accounts receivable
derecognized in
accounts receivable n.a. n.a. 400 500
Short-term borrowings
(proceeds from securitized
accounts receivable) 400 500 n.a. n.a.
Net debt 6,869 7,312 6,869 7,312
The derivative liability in the table above relates to cross currency
interest rate swaps that effectively convert principal repayments and
interest obligations to Canadian dollar obligations, and is in respect of the
U.S.$741 million debenture as at December 31, 2010 (U.S.$1,348 million
at December 31, 2009) that matures June 1, 2011. Management believes
that Net debt is a useful measure because it incorporates the exchange
rate impact of cross currency swaps put into place that fix the value
of U.S. dollar debt and because it represents the amount of long-term
debt obligations that are not covered by available cash and temporary
investments.