Telus 2010 Annual Report Download - page 5
Download and view the complete annual report
Please find page 5 of the 2010 Telus annual report below. You can navigate through the pages in the report by either clicking on the pages listed below, or by using the keyword search tool below to find specific information within the annual report.-
 1
1 -
 2
2 -
 3
3 -
 4
4 -
 5
5 -
 6
6 -
 7
7 -
 8
8 -
 9
9 -
 10
10 -
 11
11 -
 12
12 -
 13
13 -
 14
14 -
 15
15 -
 16
16 -
17
-
18
-
19
-
20
-
21
-
22
-
23
-
24
-
25
-
26
-
27
-
28
-
29
-
30
-
31
-
32
-
33
-
34
-
35
-
36
-
37
-
38
-
39
-
40
-
41
-
42
-
43
-
44
-
45
-
46
-
47
-
48
-
49
-
50
-
51
-
52
-
53
-
54
-
55
-
56
-
57
-
58
-
59
-
60
-
61
-
62
-
63
-
64
-
65
-
66
-
67
-
68
-
69
-
70
-
71
-
72
-
73
-
74
-
75
-
76
-
77
-
78
-
79
-
80
-
81
-
82
-
83
-
84
-
85
-
86
-
87
-
88
-
89
-
90
-
91
-
92
-
93
-
94
-
95
-
96
-
97
-
98
-
99
-
100
-
101
-
102
-
103
-
104
-
105
-
106
-
107
-
108
-
109
-
110
-
111
-
112
-
113
-
114
-
115
-
116
-
117
-
118
-
119
-
120
-
121
-
122
-
123
-
124
-
125
-
126
-
127
-
128
-
129
-
130
-
131
-
132
-
133
-
134
-
135
-
136
-
137
-
138
-
139
-
140
-
141
-
142
-
143
-
144
-
145
-
146
-
147
-
148
-
149
-
150
-
151
-
152
-
153
-
154
-
155
-
156
-
157
-
158
-
159
-
160
-
161
-
162
-
163
-
164
-
165
-
166
-
167
-
168
-
169
-
170
-
171
-
172
-
173
-
174
-
175
-
176
-
177
-
178
-
179
-
180
-
181
-
182
 |
 |

TELUS 2010 annual report . 1
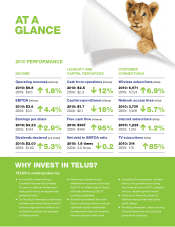
WHY INVEST IN TELUS?
AT A
GLANCE
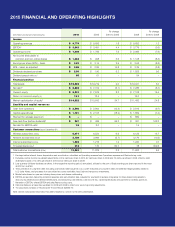
2010 PERFORMANCE
INCOME
Operating revenues (billions)
2010: $9.8
2009: $9.6 1.8%
EBITDA (billions)
2010: $3.6
2009: $3.5 4.4%
Earnings per share
2010: $3.23
2009: $3.14 2.9%
Dividends declared (per share)
2010: $2.00
2009: $1.90 5.3%
CUSTOMER
CONNECTIONS
Wireless subscribers (000s)
2010: 6,971
2009: 6,524 6.9%
Network access lines (000s)
2010: 3,739
2009: 3,966 5.7%
Internet subscribers (000s)
2010: 1,229
2009: 1,215 1.2%
TV subscribers (000s)
2010: 314
2009: 170 85%
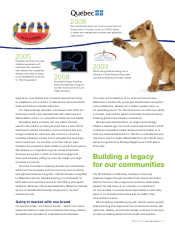
.Successfully implementing a
consistent decade-long strategy
focused on national wireless and
data growth led by an experienced
leadership team
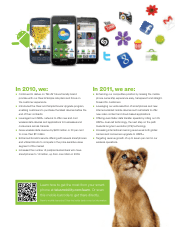
.Continuing to leverage our advanced
wireless network and future friendly®
customer approach to enhance our
competitive position and generate
profitable growth
.Delivering a superior home
entertainment experience through
Optik TV and High Speed Internet,
while also enhancing TELUS’
bundling capabilities
.Generating increased free cash
flow by realizing a return on recent
significant capital investments,
increasing earnings and lowering
interest costs and cash taxes
.Increasing the prospective dividend
payout ratio guideline and raising
the dividend twice in 2010, consistent
with our dividend growth model
.Adhering to financial policies to
maintain strong investment grade
credit ratings
.Providing transparent, award-winning
financial disclosure and corporate
governance practices.
TELUS is creating value by:
LIQUIDITY AND
CAPITAL RESOURCES
Cash from operations (billions)
2010: $2.5
2009: $2.9 12%
Capital expenditures (billions)
2010: $1.7
2009: $2.1 18%
Free cash flow (millions)
2010: $947
2009: $485 95%
Net debt to EBITDA ratio
2010: 1.8 times
2009: 2.0 times 0.2