Telus 2010 Annual Report Download - page 71
Download and view the complete annual report
Please find page 71 of the 2010 Telus annual report below. You can navigate through the pages in the report by either clicking on the pages listed below, or by using the keyword search tool below to find specific information within the annual report.
TELUS 2010 annual report . 67
.Long-term debt issue in July 2010 with early partial redemption
of U.S. dollar Notes in September 2010
On July 23, 2010, the Company successfully closed a public offering
of 5.05%, Series CH Notes maturing in July 2020, for gross pro-
ceeds of $1 billion. These Notes are redeemable at the option of the
Company, in whole at any time, or in part from time to time, on not
fewer than 30 and not more than 60 days’ prior notice, at a redemp-
tion price equal to the greater of (i) the present value of the Notes
discounted at the Government of Canada yield plus 47 basis points,
or (ii) 100% of the principal amount thereof. In addition, accrued and
unpaid interest, if any, will be paid to the date fixed for redemption.
Net proceeds of approximately $993 million were used to fund
the early partial redemption of U.S.$607 million of the Company’s
publicly held U.S. dollar, 8% Notes with a June 2011 maturity, as well
as payments to terminate cross currency interest rate swaps asso-
ciated with the redeemed Notes. The U.S. dollar Notes have an
effective interest rate of approximately 8.5%. The early redemption
resulted in a third quarter, pre-tax charge of $52 million, or after tax,
approximately $37 million or 12 cents per share.
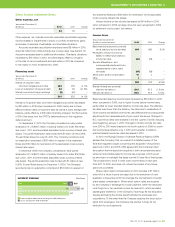
These financing activities, as well as a similar Note issue and
early partial redemption in December 2009, reduced the face value of
long-term debt maturing in June 2011 by approximately U.S.$1.2 bil-
lion and extended the average maturity of long-term debt to 5.7 years
at December 31, 2010 (five years at December 31, 2009).
.Long-term debt issues in May and December 2009 with early partial
redemption of U.S. dollar Notes in December 2009
The comparative consolidated statement of cash flows for 2009
reflects a successful $700 million public offering in May of 4.95%,
Series CF Notes maturing in May 2014. In December, the Company
also successfully closed a $1 billion public offering of 5.05%,
Series CG Notes maturing in December 2019. The net proceeds of
the December issue were used to fund the early partial redemption of
U.S.$577 million of the Company’s publicly held U.S. dollar, 8% Notes
with a June 2011 maturity, as well as payments to terminate cross
currency interest rate swaps associated with the redeemed Notes.
10
09
08
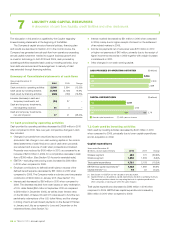
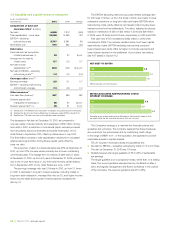
DEBT (REDUCTION) INCREASE, NET ($ millions)
10 (402)
(132)
1, 316
09
08
08
Debt increased in 2008 to help fund acquisitions and AWS spectrum purchases.
10
09
08
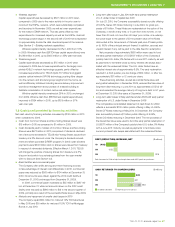
CASH RETURNED TO SHAREHOLDERS ($ millions)
10 642
601
864
280584
09
08
08
Dividends declared Normal course issuer bid
MANAGEMENT’S DISCUSSION & ANALYSIS: 7
.Wireless segment
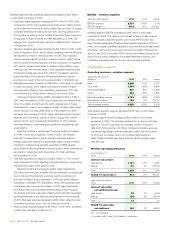
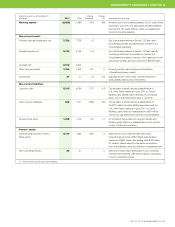
Capital expenditures decreased by $307 million in 2010 when
compared to 2009 due to the major activity in the prior year to
construct the HSPA+ network, which was substantially completed
and launched in November 2009, as well as lower expenditures
for the mature CDMA network. This was partly offset by new
expenditures for increased capacity as well as the HSPA+ dual-cell
technology project begun in the second half of 2010 that is expected
to approximately double the data download speed of the network.
(See Section 2 – Building national capabilities.)
Wireless capital intensity decreased to 9% in 2010 from 16%
in 2009. Wireless cash flow (EBITDA less capital expenditures) was
$1,568 million in 2010, up by $405 million or 35% year-over-year.
.Wireline segment
Capital expenditures decreased by $75 million in 2010 when
compared to 2009 due to lower expenditures for the largely com-
pleted ADSL2+ network technology upgrade, partly offset by
increased expenditures for TELUS Optik TV, VDSL2 and gigabit
passive optical network (GPON) technology, pushing fibre deeper
into the network and shortening loop lengths from the home, as
well as efficiency initiatives including service delivery improvement,
workforce management and purchase of a leased building to
facilitate consolidation of contact centre real estate space.
Wireline capital intensity remained at 26% in 2010, unchanged
from 2009. Wireline cash flow (EBITDA less capital expenditures)
improved to $354 million in 2010, up by $129 million or 57%
year-over-year.
7.3 Cash (used) provided by financing activities
Net cash used by financing activities increased by $124 million in 2010
when compared to 2009.
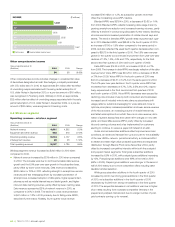
.Cash from Common Shares and Non-Voting Shares issued was
$15 million in 2010 as compared to $1 million in 2009.
.Cash dividends paid to holders of Common Shares and Non-Voting
Shares were $473 million in 2010, comprised of dividends declared
net of amounts reinvested in TELUS Non-Voting Shares issued from
treasury at a 3% discount under the Company’s dividend reinvest-
ment and share purchase (DRISP) program. In 2009, cash dividend
payments were $602 million and no shares were issued from treasury
in respect of reinvested dividends. Effective March 1, 2011, TELUS
will change the practice of issuing shares from treasury at a 3%
discount and switch to purchasing shares from the open market
with no discount (see Section 4.3).
.Bank facilities and commercial paper
The Company often shifts among short-term financing sources
to take advantage of interest cost differentials. In 2010, commercial
paper was reduced by $363 million to $104 million at December 31,
2010. No amounts were drawn against the 2012 credit facility at
December 31, 2010 (unchanged from December 31, 2009).
In 2009, commercial paper increased by $35 million to $467 mil-
lion at December 31, while net amounts drawn on the 2012 credit
facility were reduced by $980 million to $nil in the second quarter of
2009, primarily as a result of the successful Note issue in May 2009.
.Maturity and repayment of smaller debt issues in 2010
The Company repaid $50 million for matured 12% TCI Debentures
in May 2010 and $30 million for matured 11.5% TCI First Mortgage
Bonds in July 2010.


