Telus 2010 Annual Report Download - page 87
Download and view the complete annual report
Please find page 87 of the 2010 Telus annual report below. You can navigate through the pages in the report by either clicking on the pages listed below, or by using the keyword search tool below to find specific information within the annual report.-
 1
1 -
2
-
3
-
4
-
5
-
6
-
7
-
8
-
9
-
10
-
11
-
12
-
13
-
14
-
15
-
16
-
17
-
18
-
19
-
20
-
21
-
22
-
23
-
24
-
25
-
26
-
27
-
28
-
29
-
30
-
31
-
32
-
33
-
34
-
35
-
36
-
37
-
38
-
39
-
40
-
41
-
42
-
43
-
44
-
45
-
46
-
47
-
48
-
49
-
50
-
51
-
52
-
53
-
54
-
55
-
56
-
57
-
58
-
59
-
60
-
61
-
62
-
63
-
64
-
65
-
66
-
67
-
68
-
69
-
70
-
71
-
72
-
73
-
74
-
75
-
76
-
 77
77 -
 78
78 -
 79
79 -
 80
80 -
 81
81 -
 82
82 -
 83
83 -
 84
84 -
 85
85 -
 86
86 -
 87
87 -
 88
88 -
 89
89 -
 90
90 -
 91
91 -
 92
92 -
 93
93 -
 94
94 -
 95
95 -
 96
96 -
 97
97 -
98
-
99
-
100
-
101
-
102
-
103
-
104
-
105
-
106
-
107
-
108
-
109
-
110
-
111
-
112
-
113
-
114
-
115
-
116
-
117
-
118
-
119
-
120
-
121
-
122
-
123
-
124
-
125
-
126
-
127
-
128
-
129
-
130
-
131
-
132
-
133
-
134
-
135
-
136
-
137
-
138
-
139
-
140
-
141
-
142
-
143
-
144
-
145
-
146
-
147
-
148
-
149
-
150
-
151
-
152
-
153
-
154
-
155
-
156
-
157
-
158
-
159
-
160
-
161
-
162
-
163
-
164
-
165
-
166
-
167
-
168
-
169
-
170
-
171
-
172
-
173
-
174
-
175
-
176
-
177
-
178
-
179
-
180
-
181
-
182
 |
 |

TELUS 2010 annual report . 83
MANAGEMENT’S DISCUSSION & ANALYSIS: 8
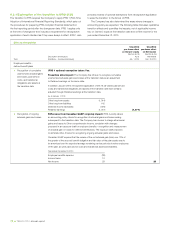
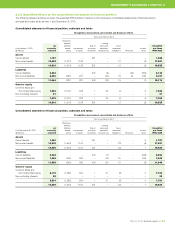
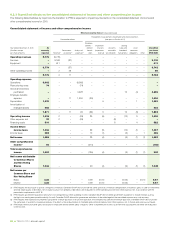
8.2.2 Quantified effects on the consolidated statements of financial position
The following tables summarize by topic, the expected IFRS transition impacts on the Company’s consolidated statements of financial position
subtotals and totals, as at January 1 and December 31, 2010.
Consolidated statement of financial position, subtotals and totals
Recognition, measurement, presentation and disclosure effects
Topics (see Section 8.2.1)
Employee
benefits Leasing
As (defined Sale of (sales and Asset Unaudited
As at January 1, 2010 currently benefit Impairment accounts leaseback retirement Income pro forma
($ millions) reported plans) of assets receivable transactions) obligations Provisions taxes IFRS-IASB
Assets
Current assets 1,127 – – 501 – – – – 1,628
Non-current assets 18,092 (1,314) 1,109 – – 12 – (2) 17,897
19,219 (1,314) 1,109 501 – 12 – (2) 19,525
Liabilities
Current liabilities 2,964 – – 500 (6) – (22) (303) 3,133
Non-current liabilities 8,680 (237) 281 – (24) 19 22 296 9,037
11,644 (237) 281 500 (30) 19 – (7) 12,170
Owners’ equity
Common Share and
Non-Voting Share equity
7,554 (1,077) 828 1 30 (7) – 5 7,334
Non-controlling interests
21 – – – – – – – 21
7,575 (1,077) 828 1 30 (7) – 5 7,355
19,219 (1,314) 1,109 501 – 12 – (2) 19,525
Consolidated statement of financial position, subtotals and totals
Recognition, measurement, presentation and disclosure effects
Topics (see Section 8.2.1)
Employee
benefits Leasing
As (defined Sale of (sales and Asset Unaudited
As at December 31, 2010 currently benefit Impairment accounts leaseback retirement Income pro forma
($ millions) reported plans) of assets receivable transactions) obligations Provisions taxes IFRS-IASB
Assets
Current assets 1,390 – – 401 – – – 6 1,797
Non-current assets 18,209 (1,504) 1,104 – – 23 – (5) 17,827
19,599 (1,504) 1,104 401 – 23 – 1 19,624
Liabilities
Current liabilities 3,949 – – 400 (7) – – (348) 3,994
Non-current liabilities 7,449 (242) 280 – (14) 31 – 345 7,849
11,398 (242) 280 400 (21) 31 – (3) 11,843
Owners’ equity
Common Share and
Non-Voting Share equity
8,179 (1,262) 824 1 21 (8) – 4 7,759
Non-controlling interests
22 – – – – – – – 22
8,201 (1,262) 824 1 21 (8) – 4 7,781
19,599 (1,504) 1,104 401 – 23 – 1 19,624