Telus 2010 Annual Report Download - page 64
Download and view the complete annual report
Please find page 64 of the 2010 Telus annual report below. You can navigate through the pages in the report by either clicking on the pages listed below, or by using the keyword search tool below to find specific information within the annual report.-
 1
1 -
2
-
3
-
4
-
5
-
6
-
7
-
8
-
9
-
10
-
11
-
12
-
13
-
14
-
15
-
16
-
17
-
18
-
19
-
20
-
21
-
22
-
23
-
24
-
25
-
26
-
27
-
28
-
29
-
30
-
31
-
32
-
33
-
34
-
35
-
36
-
37
-
38
-
39
-
40
-
41
-
42
-
43
-
44
-
45
-
46
-
47
-
48
-
49
-
50
-
51
-
52
-
53
-
 54
54 -
 55
55 -
 56
56 -
 57
57 -
 58
58 -
 59
59 -
 60
60 -
 61
61 -
 62
62 -
 63
63 -
 64
64 -
 65
65 -
 66
66 -
 67
67 -
 68
68 -
 69
69 -
 70
70 -
 71
71 -
 72
72 -
 73
73 -
 74
74 -
75
-
76
-
77
-
78
-
79
-
80
-
81
-
82
-
83
-
84
-
85
-
86
-
87
-
88
-
89
-
90
-
91
-
92
-
93
-
94
-
95
-
96
-
97
-
98
-
99
-
100
-
101
-
102
-
103
-
104
-
105
-
106
-
107
-
108
-
109
-
110
-
111
-
112
-
113
-
114
-
115
-
116
-
117
-
118
-
119
-
120
-
121
-
122
-
123
-
124
-
125
-
126
-
127
-
128
-
129
-
130
-
131
-
132
-
133
-
134
-
135
-
136
-
137
-
138
-
139
-
140
-
141
-
142
-
143
-
144
-
145
-
146
-
147
-
148
-
149
-
150
-
151
-
152
-
153
-
154
-
155
-
156
-
157
-
158
-
159
-
160
-
161
-
162
-
163
-
164
-
165
-
166
-
167
-
168
-
169
-
170
-
171
-
172
-
173
-
174
-
175
-
176
-
177
-
178
-
179
-
180
-
181
-
182
 |
 |

60 . TELUS 2010 annual report
increased $10 million or 1.2%, as subscriber growth more than
offset the moderating voice ARPU decline.
Blended ARPU was $57.64 in 2010, a decrease of $0.82 or 1.4%
from 2009. Blended ARPU reflects increasing data usage driven by
growing smartphone adoption and increased roaming volumes, partly
offset by a decline in voice pricing (discussed further below), declining
minutes used and increased penetration of mobile Internet keys and
tablets. The trend in blended ARPU growth rates improved each quar-
ter in 2010. Blended ARPU was $58.48 in the fourth quarter of 2010,
an increase of $1.10 or 1.9% when compared to the same period in
2009, and also reflected the usual fourth quarter decrease when com-
pared to $58.75 in the third quarter of 2010. The 1.9% year-over-year
growth in the quarter is a continued improvement from year-over-year
declines of 1.2%, 1.9%, 4.4% and 7.7%, respectively, for the third,
second and first quarters of 2010 and fourth quarter of 2009.
Data ARPU was $14.39 in 2010, an increase of $2.51 or 21%
from 2009. The increase in data ARPU was largely reflective of the data
revenue trend. Voice ARPU was $43.25 in 2010, a decrease of
$3.33
or 7.1% from 2009. Voice ARPU in the fourth quarter of 2010 was
$42.47, a decrease of $2.31 or 5.2% from the same period in 2009.
The 5.2% year-over-year decline in fourth quarter voice ARPU has
moderated from decreases of 6.7%, 7.2%, 9.5% and 12%, respec-
tively, experienced in the third, second and first quarters of 2010
and fourth quarter of 2009. Voice ARPU decreases were caused by:
declining voice minutes of use by both consumers and businesses;
increased use of included-minute rate plans as subscribers shift
usage patterns, substitute messaging for voice calls and move to
optimize price plans; increased penetration and lower service revenue
of the Koodo brand; an increasing volume of mobile Internet key
and tablet subscriptions from which there is no voice revenue; elimi-
nation of system access fees and carrier e911 charges on new rate
plans; and lower Mike service ARPU; partly offset by increased
inbound roaming volumes and a fee implemented for customers
electing to continue to receive a paper bill instead of an ebill.
Gross and net subscriber additions reflect improved economic
conditions, an enhanced handset line-up due in part to the availability
of the new HSPA+ network, promotional activity, a continued effort
to attract and retain high-value postpaid customers and expanded
distribution through Black’s Photo since November 2009, partly
offset by increased competitive intensity within both the postpaid
and prepaid market segments. Total gross subscriber additions
increased by 6.9% in 2010, with postpaid gross additions increasing
by 12%. Postpaid gross additions were 68% of the total in 2010
(65% in 2009). Prepaid gross additions were stronger in the second
half of 2010 mainly due to more competitive offers including data-
capable handset selection.
While gross subscriber additions in the fourth quarter of 2010
increased by 9,000 over strong gross additions in the third quarter
of 2010, net subscriber additions in the fourth quarter of 2010
decreased by 34,000 from strong net additions in the third quarter
of 2010. The sequential decrease in net additions was due to higher
churn rates resulting from increased competitive intensity in the
prepaid and postpaid markets and due to a larger number of post-
paid contracts coming up for renewal.
10
09
08
07
06
INCOME ($ millions)
10 1,038
1,366
1,002
10
09
09
08
Net income Income before income taxes
08
1,205
1,131
1,567
Other comprehensive income
Years ended December 31
($ millions) 2010 2009 Change
54 58 (6.9)%
Other comprehensive income includes changes in unrealized fair value
of derivatives designated as cash flow hedges, principally associated
with U.S. dollar debt. In 2010, an approximate $11 million after-tax effect
of unwinding swaps associated with the early partial redemption of
U.S. dollar Notes in September 2010, or a pre-tax amount of $16 million,
was recognized in Financing costs. Similarly in 2009, an approximate
$25 million after-tax effect of unwinding swaps associated with the early
partial redemption of U.S. dollar Notes in December 2009, or a pre-tax
amount of $36 million, was recognized in Financing costs.
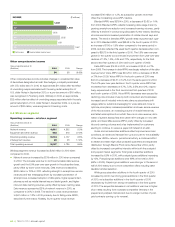
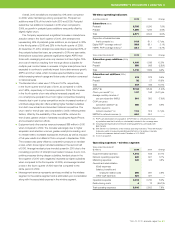
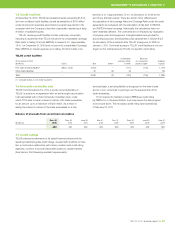
5.4 Wireless segment
Operating revenues – wireless segment
Years ended December 31
($ millions) 2010 2009 Change
Network revenue 4,611 4,392 5.0%
Equipment and other revenue 403 315 27.9%
External operating revenue 5,014 4,707 6.5%
Intersegment revenue 33 28 17.9%
Total operating revenues 5,047 4,735 6.6%
Wireless segment revenue increased by $312 million in 2010 when
compared to 2009.
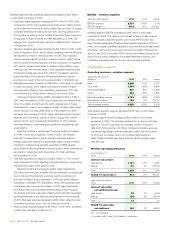
.Network revenue increased by $219 million in 2010 when compared
to 2009. The increase was due to continued wireless data revenue
growth and the 6.9% year-over-year growth in the subscriber base,
partly offset by lower voice revenues. Data revenue increased by
$260 million or 30% in 2010, reflecting strength in smartphone service
revenues and text messaging driven by increased penetration of
smartphones, increased adoption of data plans, higher-speed smart-
phones as well as mobile Internet key and tablet growth, and higher
inbound data roaming volumes, partly offset by lower roaming rates.
Data revenue represented 25% of network revenue in 2010, as
compared to 20% in 2009. The decline in voice revenue slowed
to $41 million or 1.2% in 2010 primarily due to falling voice ARPU,
described further below. Notably, fourth quarter voice revenue