Duke Energy 2015 Annual Report Download - page 97
Download and view the complete annual report
Please find page 97 of the 2015 Duke Energy annual report below. You can navigate through the pages in the report by either clicking on the pages listed below, or by using the keyword search tool below to find specific information within the annual report.-
 1
1 -
2
-
3
-
4
-
5
-
6
-
7
-
8
-
9
-
10
-
11
-
12
-
13
-
14
-
15
-
16
-
17
-
18
-
19
-
20
-
21
-
22
-
23
-
24
-
25
-
26
-
27
-
28
-
29
-
30
-
31
-
32
-
33
-
34
-
35
-
36
-
37
-
38
-
39
-
40
-
41
-
42
-
43
-
44
-
45
-
46
-
47
-
48
-
49
-
50
-
51
-
52
-
53
-
54
-
55
-
56
-
57
-
58
-
59
-
60
-
61
-
62
-
63
-
64
-
65
-
66
-
67
-
68
-
69
-
70
-
71
-
72
-
73
-
74
-
75
-
76
-
77
-
78
-
79
-
80
-
81
-
82
-
83
-
84
-
85
-
86
-
 87
87 -
 88
88 -
 89
89 -
 90
90 -
 91
91 -
 92
92 -
 93
93 -
 94
94 -
 95
95 -
 96
96 -
 97
97 -
 98
98 -
 99
99 -
 100
100 -
 101
101 -
 102
102 -
 103
103 -
 104
104 -
 105
105 -
 106
106 -
 107
107 -
108
-
109
-
110
-
111
-
112
-
113
-
114
-
115
-
116
-
117
-
118
-
119
-
120
-
121
-
122
-
123
-
124
-
125
-
126
-
127
-
128
-
129
-
130
-
131
-
132
-
133
-
134
-
135
-
136
-
137
-
138
-
139
-
140
-
141
-
142
-
143
-
144
-
145
-
146
-
147
-
148
-
149
-
150
-
151
-
152
-
153
-
154
-
155
-
156
-
157
-
158
-
159
-
160
-
161
-
162
-
163
-
164
-
165
-
166
-
167
-
168
-
169
-
170
-
171
-
172
-
173
-
174
-
175
-
176
-
177
-
178
-
179
-
180
-
181
-
182
-
183
-
184
-
185
-
186
-
187
-
188
-
189
-
190
-
191
-
192
-
193
-
194
-
195
-
196
-
197
-
198
-
199
-
200
-
201
-
202
-
203
-
204
-
205
-
206
-
207
-
208
-
209
-
210
-
211
-
212
-
213
-
214
-
215
-
216
-
217
-
218
-
219
-
220
-
221
-
222
-
223
-
224
-
225
-
226
-
227
-
228
-
229
-
230
-
231
-
232
-
233
-
234
-
235
-
236
-
237
-
238
-
239
-
240
-
241
-
242
-
243
-
244
-
245
-
246
-
247
-
248
-
249
-
250
-
251
-
252
-
253
-
254
-
255
-
256
-
257
-
258
-
259
-
260
-
261
-
262
-
263
-
264
 |
 |

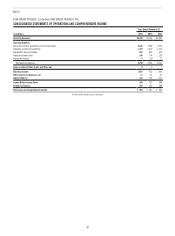
77
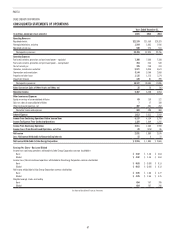
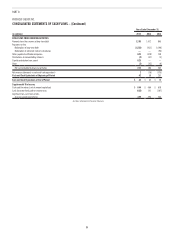
PART II
Years Ended December 31,
(in millions) 2015 2014 2013
CASH FLOWS FROM OPERATING ACTIVITIES
Net income $ 1,081 $ 1,072 $ 976
Adjustments to reconcile net income to net cash provided by operating activities:
Depreciation and amortization (including amortization of nuclear fuel) 1,361 1,273 1,167
Equity component of AFUDC (96) (91) (91)
FERC mitigation costs —3 14
Losses on sales of other assets and other, net 1— —
Impairment charges 1— —
Deferred income taxes 397 376 534
Accrued pension and other post-retirement benefit costs 15 22 38
Contributions to qualified pension plans (91) — —
Payments for asset retirement obligations (167) — —
(Increase) decrease in
Net realized and unrealized mark-to-market and hedging transactions —— (9)
Receivables 42 48 (12)
Receivables from affiliated companies (32) — (72)
Inventory (157) (60) (9)
Other current assets (51) (236) (1)
Increase (decrease) in
Accounts payable (4) 10 58
Accounts payable to affiliated companies 75 (7) 33
Taxes accrued (128) (15) 4
Other current liabilities 127 (10) (40)
Other assets 76 17 (102)
Other liabilities (77) (22) (77)
Net cash provided by operating activities 2,373 2,380 2,411
CASH FLOWS FROM INVESTING ACTIVITIES
Capital expenditures (1,933) (1,879) (1,695)
Purchases of available-for-sale securities (2,555) (2,064) (2,405)
Proceeds from sales and maturities of available-for-sale securities 2,555 2,044 2,363
Notes receivable from affiliated companies (13) 72 160
Other (35) (18) (24)
Net cash used in investing activities (1,981) (1,845) (1,601)
CASH FLOWS FROM FINANCING ACTIVITIES
Proceeds from the issuance of long-term debt 516 — 100
Payments for the redemption of long-term debt (506) (45) (405)
Distributions to parent (401) (500) (499)
Other (1) — (2)
Net cash used in financing activities (392) (545) (806)
Net (decrease) increase in cash and cash equivalents —(10) 4
Cash and cash equivalents at beginning of period 13 23 19
Cash and cash equivalents at end of period $ 13 $ 13 $ 23
Supplemental Disclosures:
Cash paid for interest, net of amount capitalized $ 389 $ 388 $ 336
Cash paid for (received from) income taxes 342 305 (7)
Significant non-cash transactions:
Accrued capital expenditures 239 194 199
See Notes to Consolidated Financial Statements
DUKE ENERGY CAROLINAS, LLC
CONSOLIDATED STATEMENTS OF CASH FLOWS