Duke Energy 2015 Annual Report Download - page 61
Download and view the complete annual report
Please find page 61 of the 2015 Duke Energy annual report below. You can navigate through the pages in the report by either clicking on the pages listed below, or by using the keyword search tool below to find specific information within the annual report.-
 1
1 -
2
-
3
-
4
-
5
-
6
-
7
-
8
-
9
-
10
-
11
-
12
-
13
-
14
-
15
-
16
-
17
-
18
-
19
-
20
-
21
-
22
-
23
-
24
-
25
-
26
-
27
-
28
-
29
-
30
-
31
-
32
-
33
-
34
-
35
-
36
-
37
-
38
-
39
-
40
-
41
-
42
-
43
-
44
-
45
-
46
-
47
-
48
-
49
-
50
-
 51
51 -
 52
52 -
 53
53 -
 54
54 -
 55
55 -
 56
56 -
 57
57 -
 58
58 -
 59
59 -
 60
60 -
 61
61 -
 62
62 -
 63
63 -
 64
64 -
 65
65 -
 66
66 -
 67
67 -
 68
68 -
 69
69 -
 70
70 -
 71
71 -
72
-
73
-
74
-
75
-
76
-
77
-
78
-
79
-
80
-
81
-
82
-
83
-
84
-
85
-
86
-
87
-
88
-
89
-
90
-
91
-
92
-
93
-
94
-
95
-
96
-
97
-
98
-
99
-
100
-
101
-
102
-
103
-
104
-
105
-
106
-
107
-
108
-
109
-
110
-
111
-
112
-
113
-
114
-
115
-
116
-
117
-
118
-
119
-
120
-
121
-
122
-
123
-
124
-
125
-
126
-
127
-
128
-
129
-
130
-
131
-
132
-
133
-
134
-
135
-
136
-
137
-
138
-
139
-
140
-
141
-
142
-
143
-
144
-
145
-
146
-
147
-
148
-
149
-
150
-
151
-
152
-
153
-
154
-
155
-
156
-
157
-
158
-
159
-
160
-
161
-
162
-
163
-
164
-
165
-
166
-
167
-
168
-
169
-
170
-
171
-
172
-
173
-
174
-
175
-
176
-
177
-
178
-
179
-
180
-
181
-
182
-
183
-
184
-
185
-
186
-
187
-
188
-
189
-
190
-
191
-
192
-
193
-
194
-
195
-
196
-
197
-
198
-
199
-
200
-
201
-
202
-
203
-
204
-
205
-
206
-
207
-
208
-
209
-
210
-
211
-
212
-
213
-
214
-
215
-
216
-
217
-
218
-
219
-
220
-
221
-
222
-
223
-
224
-
225
-
226
-
227
-
228
-
229
-
230
-
231
-
232
-
233
-
234
-
235
-
236
-
237
-
238
-
239
-
240
-
241
-
242
-
243
-
244
-
245
-
246
-
247
-
248
-
249
-
250
-
251
-
252
-
253
-
254
-
255
-
256
-
257
-
258
-
259
-
260
-
261
-
262
-
263
-
264
 |
 |

41
PART II
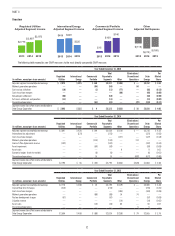
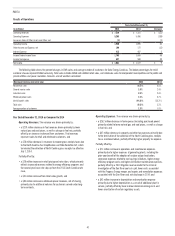
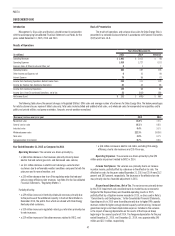
Results of Operations
Years Ended December 31,
(in millions) 2015 2014 Variance
Operating Revenues $ 7,229 $ 7,351 $ (122)
Operating Expenses 5,268 5,456 (188)
Losses on Sales of Other Assets and Other, net (1) — (1)
Operating Income 1,960 1,895 65
Other Income and Expense, net 160 172 (12)
Interest Expense 412 407 5
Income Before Income Taxes 1,708 1,660 48
Income Tax Expense 627 588 39
Net Income $ 1,081 $ 1,072 $ 9
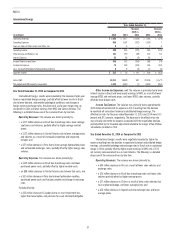
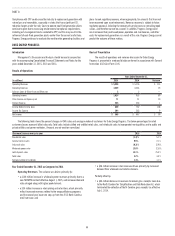
The following table shows the percent changes in GWh sales and average number of customers for Duke Energy Carolinas. The below percentages for retail
customer classes represent billed sales only. Total sales includes billed and unbilled retail sales, and wholesale sales to incorporated municipalities and to public and
private utilities and power marketers. Amounts are not weather normalized.
(Decrease) increase over prior year 2015 2014
Residential sales (0.2)% 4.0%
General service sales 1.0% 2.4%
Industrial sales 2.6% 2.4%
Wholesale power sales 1.5% 5.7%
Joint dispatch sales (44.8)% (25.7)%
Total sales (0.3)% 2.2%
Average number of customers 1.3% 1.0%
Year Ended December 31, 2015 as Compared to 2014
Operating Revenues. The variance was driven primarily by:
• a $219 million decrease in fuel revenues driven primarily by lower
natural gas and coal prices, as well as change in fuel mix, partially
offset by an increase in demand from customers. Fuel revenues
represent sales to retail and wholesale customers; and
• a $78 million decrease in revenues to recover gross receipts taxes due
to the North Carolina Tax Simplification and Rate Reduction Act, which
terminated the collection of North Carolina gross receipts tax effective
July 1, 2014.
Partially offset by:
• a $78 million increase in retail pricing and rate riders, which primarily
reflects increased revenues related to energy efficiency programs and
the second year base rate step-up from the 2013 South Carolina rate
case;
• a $51 million increase from retail sales growth; and
• a $40 million increase in wholesale power revenues, net of sharing,
primarily due to additional volumes for customers served under long-
term contracts.
Operating Expenses. The variance was driven primarily by:
• a $252 million decrease in fuel expense (including purchased power)
primarily related to lower natural gas and coal prices, as well as change
in fuel mix; and
• a $47 million decrease in property and other tax expenses primarily due
to the termination of the collection of the North Carolina gross receipts
tax as mentioned above, partially offset by higher property tax expense.
Partially offset by:
• a $71 million increase in operations and maintenance expenses
primarily due to higher expenses at generating plants, including the
prior-year benefit of the adoption of nuclear outage levelization,
severance expenses related to cost savings initiatives, higher energy
efficiency program costs and higher distribution maintenance expenses,
partially offset by a 2014 litigation reserve related to the criminal
investigation of the Dan River coal ash spill, lower costs associated
with the Progress Energy merger, and repairs and remediation expenses
associated with the Dan River coal ash discharge in 2014; and
• a $42 million increase in depreciation and amortization expense
primarily due to higher depreciation as a result of additional plant in
service, partially offset by lower nuclear decommissioning costs and
lower amortization of certain regulatory assets.