Duke Energy 2015 Annual Report Download - page 127
Download and view the complete annual report
Please find page 127 of the 2015 Duke Energy annual report below. You can navigate through the pages in the report by either clicking on the pages listed below, or by using the keyword search tool below to find specific information within the annual report.-
 1
1 -
2
-
3
-
4
-
5
-
6
-
7
-
8
-
9
-
10
-
11
-
12
-
13
-
14
-
15
-
16
-
17
-
18
-
19
-
20
-
21
-
22
-
23
-
24
-
25
-
26
-
27
-
28
-
29
-
30
-
31
-
32
-
33
-
34
-
35
-
36
-
37
-
38
-
39
-
40
-
41
-
42
-
43
-
44
-
45
-
46
-
47
-
48
-
49
-
50
-
51
-
52
-
53
-
54
-
55
-
56
-
57
-
58
-
59
-
60
-
61
-
62
-
63
-
64
-
65
-
66
-
67
-
68
-
69
-
70
-
71
-
72
-
73
-
74
-
75
-
76
-
77
-
78
-
79
-
80
-
81
-
82
-
83
-
84
-
85
-
86
-
87
-
88
-
89
-
90
-
91
-
92
-
93
-
94
-
95
-
96
-
97
-
98
-
99
-
100
-
101
-
102
-
103
-
104
-
105
-
106
-
107
-
108
-
109
-
110
-
111
-
112
-
113
-
114
-
115
-
116
-
 117
117 -
 118
118 -
 119
119 -
 120
120 -
 121
121 -
 122
122 -
 123
123 -
 124
124 -
 125
125 -
 126
126 -
 127
127 -
 128
128 -
 129
129 -
 130
130 -
 131
131 -
 132
132 -
 133
133 -
 134
134 -
 135
135 -
 136
136 -
 137
137 -
138
-
139
-
140
-
141
-
142
-
143
-
144
-
145
-
146
-
147
-
148
-
149
-
150
-
151
-
152
-
153
-
154
-
155
-
156
-
157
-
158
-
159
-
160
-
161
-
162
-
163
-
164
-
165
-
166
-
167
-
168
-
169
-
170
-
171
-
172
-
173
-
174
-
175
-
176
-
177
-
178
-
179
-
180
-
181
-
182
-
183
-
184
-
185
-
186
-
187
-
188
-
189
-
190
-
191
-
192
-
193
-
194
-
195
-
196
-
197
-
198
-
199
-
200
-
201
-
202
-
203
-
204
-
205
-
206
-
207
-
208
-
209
-
210
-
211
-
212
-
213
-
214
-
215
-
216
-
217
-
218
-
219
-
220
-
221
-
222
-
223
-
224
-
225
-
226
-
227
-
228
-
229
-
230
-
231
-
232
-
233
-
234
-
235
-
236
-
237
-
238
-
239
-
240
-
241
-
242
-
243
-
244
-
245
-
246
-
247
-
248
-
249
-
250
-
251
-
252
-
253
-
254
-
255
-
256
-
257
-
258
-
259
-
260
-
261
-
262
-
263
-
264
 |
 |

107
PART II
DUKE ENERGY CORPORATION • DUKE ENERGY CAROLINAS, LLC • PROGRESS ENERGY, INC. •
DUKE ENERGY PROGRESS, LLC. • DUKE ENERGY FLORIDA, LLC. • DUKE ENERGY OHIO, INC. • DUKE ENERGY INDIANA, INC.
Combined Notes to Consolidated Financial Statements – (Continued)
Certain prior year amounts have been reclassified to conform to the
current year presentation.
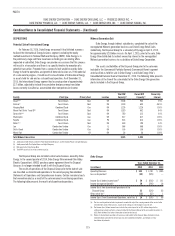
Other Current and Noncurrent Assets and Liabilities
The following table provides detail of amounts included in Other within
Current Assets or Current Liabilities on the Consolidated Balance Sheets.
December 31,
(in millions) Location 2015 2014
Duke Energy
Accrued compensation Current Liabilities $ 621 $ 638
Duke Energy Carolinas
Accrued compensation Current Liabilities $ 213 $ 216
Collateral liabilities Current Liabilities 141 128
Progress Energy
Income taxes receivable Current Assets $ 129 $ 718
Customer deposits Current Liabilities 373 360
Derivative liabilities Current Liabilities 201 271
Duke Energy Progress
Income taxes receivable Current Assets $ 111 $ 272
Customer deposits Current Liabilities 141 135
Accrued compensation Current Liabilities 108 116
Derivative liabilities Current Liabilities 76 108
Duke Energy Florida
Income taxes receivable Current Assets $ –– $ 177
Customer deposits Current Liabilities 232 225
Derivative liabilities Current Liabilities 125 163
Duke Energy Ohio
Income taxes receivable Current Assets $ 59 $ 40
Other receivable Current Assets 33 39
Accrued litigation reserve Current Liabilities 80 —
Collateral Liabilities Current Liabilities 48 42
Duke Energy Indiana
Income taxes receivable Current Assets $–– $ 98
Collateral liabilities Current Liabilities 44 43
The current portion of deferred tax assets is included within Other in
Current Assets at December 31, 2014. Due to the adoption of new accounting
guidance issued by the Financial Accounting Standards Board (FASB) related to
the balance sheet classification of deferred taxes, all deferred tax assets and
liabilities are classified as noncurrent at December 31, 2015. See Note 22 for
information related to the presentation of deferred tax assets and liabilities on
the Consolidated Balance Sheets.
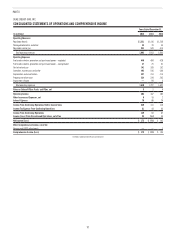
Discontinued Operations
The results of operations of the nonregulated Midwest generation
business have been classified as Discontinued Operations on the Consolidated
Statements of Operations. Duke Energy has elected to present cash flows of
discontinued operations combined with cash flows of continuing operations.
Unless otherwise noted, the notes to these consolidated financial statements
exclude amounts related to discontinued operations for all periods presented,
assets held for sale and liabilities associated with assets held for sale as of
December 31, 2014. See Note 2 for additional information.
For the year ended December 31, 2015, Duke Energy’s Income from
Discontinued Operations, net of tax was primarily related to results of operations
of the nonregulated Midwest generation business and Duke Energy Retail Sales,
LLC (collectively, the Disposal Group) prior to its sale on April 2, 2015, partially
offset by a charge for a litigation reserve related to the Disposal Group. For
the year ended December 31, 2014, Duke Energy’s Loss from Discontinued
Operations, net of tax was primarily related to a write-down of the carrying
amount of the assets to the estimated fair value of the Disposal Group, based
on the transaction price included in the purchase sale agreement, and the
operations of the Disposal Group. For the years ended December 31, 2013, Duke
Energy’s Income From Discontinued Operations, net of tax was primarily related
to the operations of the Disposal Group. See Note 2 for additional information.
For the years ended December 31, 2015, 2014 and 2013, Progress
Energy’s (Loss) Income From Discontinued Operations, net of tax was primarily
due to tax impacts related to prior sales of diversified businesses.
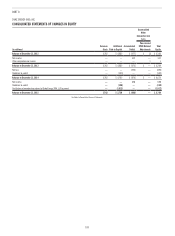
Amounts Attributable to Controlling Interests
For the year ended December 31, 2015, the amount of Income from
Discontinued Operations, net of tax presented on the Consolidated Statements
of Operations is fully attributable to controlling interests.
During 2014, Duke Energy and Progress Energy’s amount of Income
(Loss) from Discontinued Operations, net of tax presented on the Consolidated
Statements of Operations includes amounts attributable to noncontrolling
interest. The following table presents Net Income Attributable to Duke Energy
Corporation for continuing operations and discontinued operations for the years
ended December 31, 2014 and 2013.
Years ended December 31,
2014 2013
(in millions)
Duke
Energy
Progress
Energy
Duke
Energy
Progress
Energy
Income from Continuing Operations $ 2,465 $ 880 2,590 659
Income from Continuing Operations Attributable to Noncontrolling Interests 14 5 16 3
Income from Continuing Operations Attributable to Duke Energy Corporation $ 2,451 $ 875 $ 2,574 $ 656
(Loss) Income From Discontinued Operations, net of tax $ (576) $ (6) 86 16
Loss from Discontinued Operations Attributable to Noncontrolling Interests, net of tax (8) — (5) —
(Loss) Income From Discontinued Operations Attributable to Duke Energy Corporation, net of tax $ (568) $ (6) $ 91 $ 16
Net Income $ 1,889 $ 874 $ 2,676 $ 675
Net Income Attributable to Noncontrolling Interests 6 5 11 3
Net Income Attributable to Duke Energy Corporation $ 1,883 $ 869 $ 2,665 $ 672