Duke Energy 2015 Annual Report Download - page 171
Download and view the complete annual report
Please find page 171 of the 2015 Duke Energy annual report below. You can navigate through the pages in the report by either clicking on the pages listed below, or by using the keyword search tool below to find specific information within the annual report.-
 1
1 -
2
-
3
-
4
-
5
-
6
-
7
-
8
-
9
-
10
-
11
-
12
-
13
-
14
-
15
-
16
-
17
-
18
-
19
-
20
-
21
-
22
-
23
-
24
-
25
-
26
-
27
-
28
-
29
-
30
-
31
-
32
-
33
-
34
-
35
-
36
-
37
-
38
-
39
-
40
-
41
-
42
-
43
-
44
-
45
-
46
-
47
-
48
-
49
-
50
-
51
-
52
-
53
-
54
-
55
-
56
-
57
-
58
-
59
-
60
-
61
-
62
-
63
-
64
-
65
-
66
-
67
-
68
-
69
-
70
-
71
-
72
-
73
-
74
-
75
-
76
-
77
-
78
-
79
-
80
-
81
-
82
-
83
-
84
-
85
-
86
-
87
-
88
-
89
-
90
-
91
-
92
-
93
-
94
-
95
-
96
-
97
-
98
-
99
-
100
-
101
-
102
-
103
-
104
-
105
-
106
-
107
-
108
-
109
-
110
-
111
-
112
-
113
-
114
-
115
-
116
-
117
-
118
-
119
-
120
-
121
-
122
-
123
-
124
-
125
-
126
-
127
-
128
-
129
-
130
-
131
-
132
-
133
-
134
-
135
-
136
-
137
-
138
-
139
-
140
-
141
-
142
-
143
-
144
-
145
-
146
-
147
-
148
-
149
-
150
-
151
-
152
-
153
-
154
-
155
-
156
-
157
-
158
-
159
-
160
-
 161
161 -
 162
162 -
 163
163 -
 164
164 -
 165
165 -
 166
166 -
 167
167 -
 168
168 -
 169
169 -
 170
170 -
 171
171 -
 172
172 -
 173
173 -
 174
174 -
 175
175 -
 176
176 -
 177
177 -
 178
178 -
 179
179 -
 180
180 -
 181
181 -
182
-
183
-
184
-
185
-
186
-
187
-
188
-
189
-
190
-
191
-
192
-
193
-
194
-
195
-
196
-
197
-
198
-
199
-
200
-
201
-
202
-
203
-
204
-
205
-
206
-
207
-
208
-
209
-
210
-
211
-
212
-
213
-
214
-
215
-
216
-
217
-
218
-
219
-
220
-
221
-
222
-
223
-
224
-
225
-
226
-
227
-
228
-
229
-
230
-
231
-
232
-
233
-
234
-
235
-
236
-
237
-
238
-
239
-
240
-
241
-
242
-
243
-
244
-
245
-
246
-
247
-
248
-
249
-
250
-
251
-
252
-
253
-
254
-
255
-
256
-
257
-
258
-
259
-
260
-
261
-
262
-
263
-
264
 |
 |

151
PART II
DUKE ENERGY CORPORATION • DUKE ENERGY CAROLINAS, LLC • PROGRESS ENERGY, INC. •
DUKE ENERGY PROGRESS, LLC • DUKE ENERGY FLORIDA, LLC • DUKE ENERGY OHIO, INC. • DUKE ENERGY INDIANA, INC.
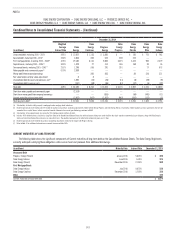
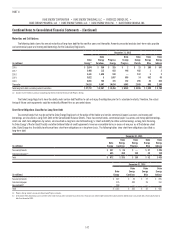
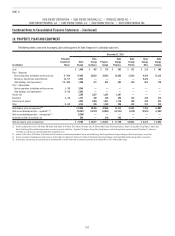
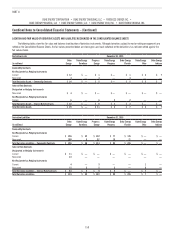
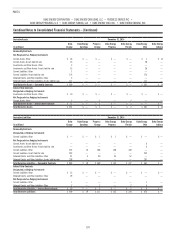
Combined Notes to Consolidated Financial Statements – (Continued)
December 31, 2014
(in millions)
Estimated
Useful Life
(Years)
Duke
Energy
Duke
Energy
Carolinas
Progress
Energy
Duke
Energy
Progress
Duke
Energy
Florida
Duke
Energy
Ohio
Duke
Energy
Indiana
Land $ 1,459 $ 403 $ 704 $ 380 $ 324 $ 114 $ 108
Plant – Regulated
Electric generation, distribution and transmission 2 - 138 82,206 31,751 33,672 20,616 13,056 3,956 11,911
Natural gas transmission and distribution 12 - 67 2,230 — — — — 2,230 —
Other buildings and improvements 9 - 100 1,445 465 607 286 318 200 173
Plant – Nonregulated
Electric generation, distribution and transmission 1 - 30 2,380 — — — — — —
Other buildings and improvements 5 - 50 2,498 — — — — — —
Nuclear fuel 2,865 1,676 1,190 1,190 — — —
Equipment 3 - 34 1,762 341 506 388 118 330 166
Construction in process 4,519 2,081 1,215 908 307 97 481
Other 5 - 80 3,497 655 756 439 310 214 195
Total property, plant and equipment(a)(d) 104,861 37,372 38,650 24,207 14,433 7,141 13,034
Total accumulated depreciation – regulated(b)(c)(d) (32,628) (12,700) (13,506) (9,021) (4,478) (2,213) (4,219)
Total accumulated depreciation – nonregulated(c)(d) (2,196) — — — — — —
Generation facilities to be retired, net 9 — — — — 9 —
Total net property, plant and equipment $ 70,046 $ 24,672 $ 25,144 $15,186 $ 9,955 $ 4,937 $ 8,815
(a) Includes capitalized leases of $1,548 million, $40 million, $315 million, $146 million, $169 million, $98 million, and $30 million at Duke Energy, Duke Energy Carolinas, Progress Energy, Duke Energy Progress, Duke Energy
Florida, Duke Energy Ohio and Duke Energy Indiana, respectively, primarily within Plant – Regulated. The Progress Energy, Duke Energy Progress and Duke Energy Florida amounts are net of $72 million, $5 million and
$67 million, respectively, of accumulated amortization of capitalized leases.
(b) Includes $1,408 million, $847 million, $561 million and $561 million of accumulated amortization of nuclear fuel at Duke Energy, Duke Energy Carolinas, Progress Energy and Duke Energy Progress, respectively.
(c) Includes accumulated amortization of capitalized leases of $52 million, $8 million, $25 million and $6 million at Duke Energy, Duke Energy Carolinas, Duke Energy Ohio and Duke Energy Indiana, respectively.
(d) Includes gross property, plant and equipment cost of consolidated VIEs of $1,873 million and accumulated depreciation of consolidated VIEs of $257 million at Duke Energy.
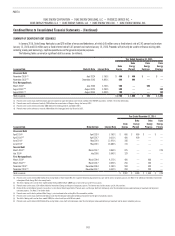
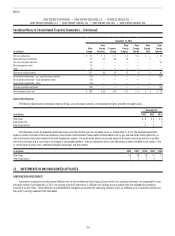
The following table presents capitalized interest, which includes the debt component of AFUDC.
Years Ended December 31,
(in millions) 2015 2014 2013
Duke Energy $98 $ 75 $ 89
Duke Energy Carolinas 38 38 41
Progress Energy 24 11 19
Duke Energy Progress 20 10 16
Duke Energy Florida 41 3
Duke Energy Ohio 10 10 11
Duke Energy Indiana 66 9
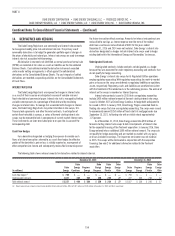
Operating Leases
Duke Energy’s Commercial Portfolio segment operates various renewable
energy projects and sells the generated output to utilities, electric cooperatives,
municipalities, and commercial and industrial customers through long-term
contracts. In certain situations, these long-term contracts and the associated
renewable energy projects qualify as operating leases. Rental income from
these leases is accounted for as Operating Revenues in the Consolidated
Statements of Operations. There are no minimum lease payments as all
payments are contingent based on actual electricity generated by the renewable
energy projects. Contingent lease payments were $172 million, $164 million
and $154 million for the years ended December 31, 2015, 2014 and 2013.
As of December 31, 2015, renewable energy projects owned by Duke Energy
and accounted for as operating leases had a cost basis of $2,455 million
and accumulated depreciation of $258 million. These assets are principally
classified as nonregulated electric generation and transmission assets.