Duke Energy 2015 Annual Report Download - page 75
Download and view the complete annual report
Please find page 75 of the 2015 Duke Energy annual report below. You can navigate through the pages in the report by either clicking on the pages listed below, or by using the keyword search tool below to find specific information within the annual report.-
 1
1 -
2
-
3
-
4
-
5
-
6
-
7
-
8
-
9
-
10
-
11
-
12
-
13
-
14
-
15
-
16
-
17
-
18
-
19
-
20
-
21
-
22
-
23
-
24
-
25
-
26
-
27
-
28
-
29
-
30
-
31
-
32
-
33
-
34
-
35
-
36
-
37
-
38
-
39
-
40
-
41
-
42
-
43
-
44
-
45
-
46
-
47
-
48
-
49
-
50
-
51
-
52
-
53
-
54
-
55
-
56
-
57
-
58
-
59
-
60
-
61
-
62
-
63
-
64
-
 65
65 -
 66
66 -
 67
67 -
 68
68 -
 69
69 -
 70
70 -
 71
71 -
 72
72 -
 73
73 -
 74
74 -
 75
75 -
 76
76 -
 77
77 -
 78
78 -
 79
79 -
 80
80 -
 81
81 -
 82
82 -
 83
83 -
 84
84 -
 85
85 -
86
-
87
-
88
-
89
-
90
-
91
-
92
-
93
-
94
-
95
-
96
-
97
-
98
-
99
-
100
-
101
-
102
-
103
-
104
-
105
-
106
-
107
-
108
-
109
-
110
-
111
-
112
-
113
-
114
-
115
-
116
-
117
-
118
-
119
-
120
-
121
-
122
-
123
-
124
-
125
-
126
-
127
-
128
-
129
-
130
-
131
-
132
-
133
-
134
-
135
-
136
-
137
-
138
-
139
-
140
-
141
-
142
-
143
-
144
-
145
-
146
-
147
-
148
-
149
-
150
-
151
-
152
-
153
-
154
-
155
-
156
-
157
-
158
-
159
-
160
-
161
-
162
-
163
-
164
-
165
-
166
-
167
-
168
-
169
-
170
-
171
-
172
-
173
-
174
-
175
-
176
-
177
-
178
-
179
-
180
-
181
-
182
-
183
-
184
-
185
-
186
-
187
-
188
-
189
-
190
-
191
-
192
-
193
-
194
-
195
-
196
-
197
-
198
-
199
-
200
-
201
-
202
-
203
-
204
-
205
-
206
-
207
-
208
-
209
-
210
-
211
-
212
-
213
-
214
-
215
-
216
-
217
-
218
-
219
-
220
-
221
-
222
-
223
-
224
-
225
-
226
-
227
-
228
-
229
-
230
-
231
-
232
-
233
-
234
-
235
-
236
-
237
-
238
-
239
-
240
-
241
-
242
-
243
-
244
-
245
-
246
-
247
-
248
-
249
-
250
-
251
-
252
-
253
-
254
-
255
-
256
-
257
-
258
-
259
-
260
-
261
-
262
-
263
-
264
 |
 |

55
PART II
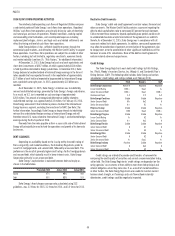
CASH FLOWS FROM OPERATING ACTIVITIES
The relatively stable operating cash flows of Regulated Utilities compose
a substantial portion of Duke Energy’s cash flows from operations. Regulated
Utilities’ cash flows from operations are primarily driven by sales of electricity
and natural gas and costs of operations. Weather conditions, working capital
and commodity price fluctuations, and unanticipated expenses including
unplanned plant outages, storms, and legal costs and related settlements can
affect the timing and level of cash flows from operations.
Duke Energy believes it has sufficient liquidity resources through the
commercial paper markets, and ultimately, the Master Credit Facility, to support
these operations. Cash flows from operations are subject to a number of other
factors, including, but not limited to, regulatory constraints, economic trends
and market volatility (see Item 1A, “Risk Factors,” for additional information).
At December 31, 2015, Duke Energy had cash and cash equivalents and
short-term investments of $857 million, of which approximately $534 million
is held by entities domiciled in foreign jurisdictions. In December 2014, Duke
Energy declared a taxable dividend of historical foreign earnings in the form of
notes payable that was expected to result in the repatriation of approximately
$2.7 billion of cash held and expected to be generated by International Energy
over a period of up to eight years. In 2015, approximately $1.5 billion was
remitted.
As of December 31, 2015, Duke Energy’s intention was to indefinitely
reinvest undistributed earnings generated by Duke Energy’s foreign subsidiaries.
As a result, no U.S. tax is recorded on such earnings of approximately
$250 million. The amount of unrecognized deferred tax liability related to
undistributed earnings was approximately $12 million. On February 18, 2016,
Duke Energy announced it had initiated a process to divest the International
Energy business segment, excluding the investment in NMC. See Note 2 for
further information. Accordingly, Duke Energy no longer intends to indefinitely
reinvest the undistributed foreign earnings of International Energy and will
therefore record U.S. taxes related to International Energy’s undistributed foreign
earnings during the first quarter of 2016.
Proceeds from the notes payable or from a successful sale of International
Energy will principally be used to fund the operations and growth of its domestic
businesses.
DEBT ISSUANCES
Depending on availability based on the issuing entity, the credit rating of
the issuing entity, and market conditions, the Subsidiary Registrants prefer to
issue first mortgage bonds and secured debt, followed by unsecured debt. This
preference is the result of generally higher credit ratings for first mortgage bonds
and secured debt, which typically result in lower interest costs. Duke Energy
Corporation primarily issues unsecured debt.
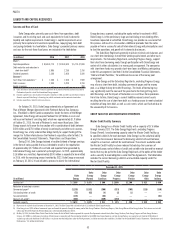
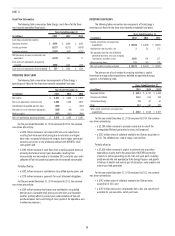
Duke Energy’s capitalization is balanced between debt and equity as
shown in the table below.
Projected 2016 Actual 2015 Actual 2014
Equity 47% 48% 49%
Debt 53% 52% 51%
Duke Energy’s fixed charges coverage ratio, calculated using SEC
guidelines, was 3.2 times for 2015, 3.2 times for 2014, and 3.0 times for 2013.
Restrictive Debt Covenants
Duke Energy’s debt and credit agreements contain various financial and
other covenants. The Master Credit Facility contains a covenant requiring the
debt-to-total capitalization ratio to not exceed 65 percent for each borrower.
Failure to meet those covenants beyond applicable grace periods could result
in accelerated due dates and/or termination of the agreements or sublimits
thereto. As of December 31, 2015, Duke Energy was in compliance with all
covenants related to its debt agreements. In addition, some credit agreements
may allow for acceleration of payments or termination of the agreements due
to nonpayment, or to the acceleration of other significant indebtedness of the
borrower or some of its subsidiaries. None of the debt or credit agreements
contain material adverse change clauses.
Credit Ratings
The Duke Energy Registrants each hold credit ratings by Fitch Ratings,
Inc. (Fitch), Moody’s Investors Service, Inc. (Moody’s) and Standard & Poor’s
Rating Services (S&P). The following table includes Duke Energy and certain
subsidiaries’ credit ratings and ratings outlook as of February 2016.
Fitch Moody’s S&P
Duke Energy Corporation Watch-N Negative Negative
Issuer Credit Rating BBB+ Baa1 A-
Senior Unsecured Debt BBB+ Baa1 BBB+
Commercial Paper F-2 P-2 A-2
Duke Energy Carolinas Stable Stable Negative
Senior Secured Debt AA- Aa2 A
Senior Unsecured Debt A+ A1 A-
Progress Energy Stable Stable Negative
Senior Unsecured Debt BBB Baa2 BBB+
Duke Energy Progress Stable Stable Negative
Issuer Credit Rating A- A2 A-
Senior Secured Debt A+ Aa3 A
Duke Energy Florida Stable Stable Negative
Senior Secured Debt A A1 A
Senior Unsecured Debt A- A3 A-
Duke Energy Ohio Stable Stable Negative
Senior Secured Debt A A2 A
Senior Unsecured Debt A- Baa1 A-
Duke Energy Indiana Positive Stable Negative
Senior Secured Debt A Aa3 A
Senior Unsecured Debt A- A2 A-
Credit ratings are intended to provide credit lenders a framework for
comparing the credit quality of securities and are not a recommendation to buy,
sell or hold. The Duke Energy Registrants’ credit ratings are dependent on the
rating agencies’ assessments of their ability to meet their debt principal and
interest obligations when they come due. If, as a result of market conditions
or other factors, the Duke Energy Registrants are unable to maintain current
balance sheet strength, or if earnings and cash flow outlook materially
deteriorates, credit ratings could be negatively impacted.