Duke Energy 2015 Annual Report Download - page 72
Download and view the complete annual report
Please find page 72 of the 2015 Duke Energy annual report below. You can navigate through the pages in the report by either clicking on the pages listed below, or by using the keyword search tool below to find specific information within the annual report.-
 1
1 -
2
-
3
-
4
-
5
-
6
-
7
-
8
-
9
-
10
-
11
-
12
-
13
-
14
-
15
-
16
-
17
-
18
-
19
-
20
-
21
-
22
-
23
-
24
-
25
-
26
-
27
-
28
-
29
-
30
-
31
-
32
-
33
-
34
-
35
-
36
-
37
-
38
-
39
-
40
-
41
-
42
-
43
-
44
-
45
-
46
-
47
-
48
-
49
-
50
-
51
-
52
-
53
-
54
-
55
-
56
-
57
-
58
-
59
-
60
-
61
-
 62
62 -
 63
63 -
 64
64 -
 65
65 -
 66
66 -
 67
67 -
 68
68 -
 69
69 -
 70
70 -
 71
71 -
 72
72 -
 73
73 -
 74
74 -
 75
75 -
 76
76 -
 77
77 -
 78
78 -
 79
79 -
 80
80 -
 81
81 -
 82
82 -
83
-
84
-
85
-
86
-
87
-
88
-
89
-
90
-
91
-
92
-
93
-
94
-
95
-
96
-
97
-
98
-
99
-
100
-
101
-
102
-
103
-
104
-
105
-
106
-
107
-
108
-
109
-
110
-
111
-
112
-
113
-
114
-
115
-
116
-
117
-
118
-
119
-
120
-
121
-
122
-
123
-
124
-
125
-
126
-
127
-
128
-
129
-
130
-
131
-
132
-
133
-
134
-
135
-
136
-
137
-
138
-
139
-
140
-
141
-
142
-
143
-
144
-
145
-
146
-
147
-
148
-
149
-
150
-
151
-
152
-
153
-
154
-
155
-
156
-
157
-
158
-
159
-
160
-
161
-
162
-
163
-
164
-
165
-
166
-
167
-
168
-
169
-
170
-
171
-
172
-
173
-
174
-
175
-
176
-
177
-
178
-
179
-
180
-
181
-
182
-
183
-
184
-
185
-
186
-
187
-
188
-
189
-
190
-
191
-
192
-
193
-
194
-
195
-
196
-
197
-
198
-
199
-
200
-
201
-
202
-
203
-
204
-
205
-
206
-
207
-
208
-
209
-
210
-
211
-
212
-
213
-
214
-
215
-
216
-
217
-
218
-
219
-
220
-
221
-
222
-
223
-
224
-
225
-
226
-
227
-
228
-
229
-
230
-
231
-
232
-
233
-
234
-
235
-
236
-
237
-
238
-
239
-
240
-
241
-
242
-
243
-
244
-
245
-
246
-
247
-
248
-
249
-
250
-
251
-
252
-
253
-
254
-
255
-
256
-
257
-
258
-
259
-
260
-
261
-
262
-
263
-
264
 |
 |

52
PART II
are primarily held to hedge the pension liability. Hedge funds, real estate and
other global securities are held for diversification. Investments within asset
classes are diversified to achieve broad market participation and reduce the
impact of individual managers on investments. In 2013, Duke Energy adopted
a de-risking investment strategy for its pension assets. As the funded status of
the plans increase, over time the targeted allocation to return seeking assets will
be reduced and the targeted allocation to fixed-income assets will be increased
to better manage Duke Energy’s pension liability and reduced funded status
volatility. Effective January 1, 2016, based on the current funded status of the
plans, the asset allocation for the Duke Energy pension plans has been adjusted
to 63 percent fixed-income assets and 37 percent return-seeking assets. Duke
Energy regularly reviews its actual asset allocation and periodically rebalances
its investments to the targeted allocations when considered appropriate.
The assets for Duke Energy’s pension and other post-retirement plans are
maintained in a master trust. Duke Energy also invests other post-retirement
assets in the Duke Energy Corporation Employee Benefits Trust (VEBA I). The
investment objective of VEBA I is to achieve sufficient returns, subject to a
prudent level of portfolio risk, for the purpose of promoting the security of plan
benefits for participants. VEBA I is passively managed.
Duke Energy discounted its future U.S. pension and other post-retirement
obligations using a rate of 4.4 percent as of December 31, 2015. Discount rates
used to measure benefit plan obligations for financial reporting purposes reflect
rates at which pension benefits could be effectively settled. As of December 31,
2015, Duke Energy determined its discount rate for U.S. pension and other
post-retirement obligations using a bond selection-settlement portfolio
approach. This approach develops a discount rate by selecting a portfolio of high
quality corporate bonds that generate sufficient cash flow to match the timing
of projected benefit payments. The selected bond portfolio is derived from a
universe of non-callable corporate bonds rated Aa quality or higher. After the
bond portfolio is selected, a single interest rate is determined that equates the
present value of the plan’s projected benefit payments discounted at this rate
with the market value of the bonds selected.
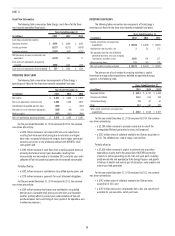
Future changes in plan asset returns, assumed discount rates and
various other factors related to the participants in Duke Energy’s pension and
post-retirement plans will impact future pension expense and liabilities. Duke
Energy cannot predict with certainty what these factors will be in the future. The
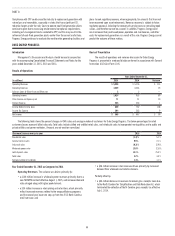
following table presents the approximate effect on Duke Energy’s 2015 pretax
pension expense, pretax other post-retirement expense, pension obligation and
other post-retirement benefit obligation if a 0.25 percent change in rates were
to occur.
Qualified and Non-
Qualified Pension Plans Other Post-Retirement Plans
(in millions) 0.25% (0.25)% 0.25% (0.25 )%
Effect on 2015 pretax pension and other post-retirement expense
Expected long-term rate of return $ (20) $ 20 $ (1) $ 1
Discount rate (14) 13 (1) 1
Effect on pension and other post-retirement benefit obligation at December 31, 2015
Discount rate (200) 206 (17) 17
Duke Energy’s U.S. other post-retirement plan uses a health care trend rate covering both pre- and post-age 65 retired plan participants, which is comprised
of a medical care trend rate, which reflects the near- and long-term expectation of increases in medical costs, and a prescription drug trend rate, which reflects the
near and long-term expectation of increases in prescription drug costs. As of December 31, 2015, the health care trend rate was 7.5 percent, trending down to 4.75
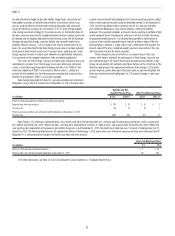
percent by 2023. The following table presents the approximate effect on Duke Energy’s 2015 pretax other post-retirement expense and other post-retirement benefit
obligation if a 1 percentage point change in the health care trend rate were to occur.
Other Post-Retirement Plans
(in millions) 1% (1)%
Effect on 2015 other post-retirement expense $ 7 $ (6)
Effect on other post-retirement benefit obligation at December 31, 2015 29 (26)
For further information, see Note 21 to the Consolidated Financial Statements, “Employee Benefit Plans.”