Duke Energy 2015 Annual Report Download - page 73
Download and view the complete annual report
Please find page 73 of the 2015 Duke Energy annual report below. You can navigate through the pages in the report by either clicking on the pages listed below, or by using the keyword search tool below to find specific information within the annual report.-
 1
1 -
2
-
3
-
4
-
5
-
6
-
7
-
8
-
9
-
10
-
11
-
12
-
13
-
14
-
15
-
16
-
17
-
18
-
19
-
20
-
21
-
22
-
23
-
24
-
25
-
26
-
27
-
28
-
29
-
30
-
31
-
32
-
33
-
34
-
35
-
36
-
37
-
38
-
39
-
40
-
41
-
42
-
43
-
44
-
45
-
46
-
47
-
48
-
49
-
50
-
51
-
52
-
53
-
54
-
55
-
56
-
57
-
58
-
59
-
60
-
61
-
62
-
 63
63 -
 64
64 -
 65
65 -
 66
66 -
 67
67 -
 68
68 -
 69
69 -
 70
70 -
 71
71 -
 72
72 -
 73
73 -
 74
74 -
 75
75 -
 76
76 -
 77
77 -
 78
78 -
 79
79 -
 80
80 -
 81
81 -
 82
82 -
 83
83 -
84
-
85
-
86
-
87
-
88
-
89
-
90
-
91
-
92
-
93
-
94
-
95
-
96
-
97
-
98
-
99
-
100
-
101
-
102
-
103
-
104
-
105
-
106
-
107
-
108
-
109
-
110
-
111
-
112
-
113
-
114
-
115
-
116
-
117
-
118
-
119
-
120
-
121
-
122
-
123
-
124
-
125
-
126
-
127
-
128
-
129
-
130
-
131
-
132
-
133
-
134
-
135
-
136
-
137
-
138
-
139
-
140
-
141
-
142
-
143
-
144
-
145
-
146
-
147
-
148
-
149
-
150
-
151
-
152
-
153
-
154
-
155
-
156
-
157
-
158
-
159
-
160
-
161
-
162
-
163
-
164
-
165
-
166
-
167
-
168
-
169
-
170
-
171
-
172
-
173
-
174
-
175
-
176
-
177
-
178
-
179
-
180
-
181
-
182
-
183
-
184
-
185
-
186
-
187
-
188
-
189
-
190
-
191
-
192
-
193
-
194
-
195
-
196
-
197
-
198
-
199
-
200
-
201
-
202
-
203
-
204
-
205
-
206
-
207
-
208
-
209
-
210
-
211
-
212
-
213
-
214
-
215
-
216
-
217
-
218
-
219
-
220
-
221
-
222
-
223
-
224
-
225
-
226
-
227
-
228
-
229
-
230
-
231
-
232
-
233
-
234
-
235
-
236
-
237
-
238
-
239
-
240
-
241
-
242
-
243
-
244
-
245
-
246
-
247
-
248
-
249
-
250
-
251
-
252
-
253
-
254
-
255
-
256
-
257
-
258
-
259
-
260
-
261
-
262
-
263
-
264
 |
 |

53
PART II
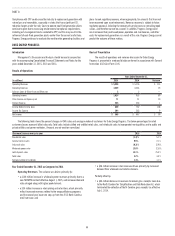
LIQUIDITY AND CAPITAL RESOURCES
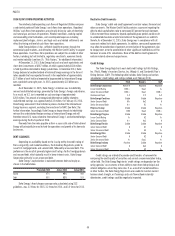
Sources and Uses of Cash
Duke Energy relies primarily upon cash flows from operations, debt
issuances and its existing cash and cash equivalents to fund its domestic
liquidity and capital requirements. Duke Energy’s capital requirements arise
primarily from capital and investment expenditures, repaying long-term debt
and paying dividends to shareholders. Duke Energy’s projected primary sources
and uses for the next three fiscal years are included in the table below.
(in millions) 2016 2017 2018
Uses(a):
Capital expenditures $ 8,600-8,775 $ 7,300-8,500 $ 6,775-$7,800
Debt maturities and reduction in
short-term debt(b) 3,885 2,250 2,750
Dividend payments 2,300 2,400 2,500
Sources(a):
Cash flows from operations(c) $ 7,200 $ 7,500 $ 7,900
Debt issuances 7,050 5,200 4,150
Equity issuances — — 350
(a) Uses and Sources exclude amounts related to payments for or proceeds from the planned acquisition of
Piedmont and possible sale of the International Energy segment.
(b) Excludes capital leases and securitized receivables maturities in 2016 and 2017 expected to be renewed.
Amounts represent Duke Energy’s financing plan, which accelerates certain contractual maturities.
(c) Includes expenditures related to ash basin closures.
On October 24, 2015, Duke Energy entered into an Agreement and
Plan of Merger (Merger Agreement) with Piedmont Natural Gas Company,
Inc., (Piedmont) a North Carolina corporation. Under the terms of the Merger
Agreement, Duke Energy will acquire Piedmont for $4.9 billion in cash and
will assume Piedmont’s existing debt, which was approximately $1.9 billion
at October 31, 2015, the end of Piedmont’s most recent fiscal year. Duke
Energy expects to finance the transaction with a combination of debt, between
$500 million and $750 million of newly issued equity and other cash sources.
Duke Energy has a fully underwritten bridge facility to support funding of the
merger. For further information on the Piedmont acquisition, refer to Note 2 to
the Consolidated Financial Statements, “Acquisitions and Dispositions.”
During 2014, Duke Energy declared a taxable dividend of foreign earnings
in the form of notes payable that was intended to result in the repatriation
of approximately $2.7 billion of cash held and expected to be generated by
International Energy over a period of up to eight years. In 2015, approximately
$1.5 billion was remitted. Approximately $300 million is expected to be remitted
in 2016, with the remaining amount remitted by 2022. Duke Energy announced
on February 18, 2016, it had initiated a process to divest the International
Energy business segment, excluding the equity method investment in NMC.
Duke Energy is in the preliminary stage and no binding or non-binding offers
have been requested or submitted. Duke Energy can provide no assurance that
this process will result in a transaction. Additional proceeds from the notes
payable or from a successful sale of International Energy will principally be used
to fund the operations and growth of its domestic businesses.
The Subsidiary Registrants generally maintain minimal cash balances and
use short-term borrowings to meet their working capital needs and other cash
requirements. The Subsidiary Registrants, excluding Progress Energy, support
their short-term borrowing needs through participation with Duke Energy and
certain of its other subsidiaries in a money pool arrangement. The companies
with short-term funds may provide short-term loans to affiliates participating
under this arrangement. See Note 6 to the Consolidated Financial Statements,
“Debt and Credit Facilities,” for additional discussion of the money pool
arrangement.
Duke Energy and the Subsidiary Registrants, excluding Progress Energy,
may also use short-term debt, including commercial paper and the money
pool, as a bridge to long-term debt financings. The levels of borrowing may
vary significantly over the course of the year due to the timing of long-term
debt financings and the impact of fluctuations in cash flows from operations.
From time to time, Duke Energy’s current liabilities exceed current assets
resulting from the use of short-term debt as a funding source to meet scheduled
maturities of long-term debt, as well as cash needs, which can fluctuate due to
the seasonality of its business.
CREDIT FACILITIES AND REGISTRATION STATEMENTS
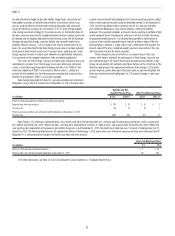
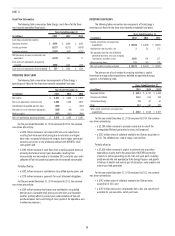
Master Credit Facility Summary
Duke Energy has a Master Credit Facility with a capacity of $7.5 billion
through January 2020. The Duke Energy Registrants, excluding Progress
Energy (Parent), have borrowing capacity under the Master Credit Facility up
to specified sublimits for each borrower. Duke Energy has the unilateral ability
at any time to increase or decrease the borrowing sublimits of each borrower,
subject to a maximum sublimit for each borrower. The amount available under
the Master Credit Facility has been reduced to backstop the issuances of
commercial paper, certain letters of credit and variable-rate demand tax-exempt
bonds that may be put to the Duke Energy Registrants at the option of the holder
and as security to meet obligations under the Plea Agreements. The table below
includes the current borrowing sublimits and available capacity under the
Master Credit Facility.
December 31, 2015
Duke
Energy
Duke
Energy
(Parent)
Duke
Energy
Carolinas
Duke
Energy
Progress
Duke
Energy
Florida
Duke
Energy
Ohio
Duke
Energy
Indiana(in millions)
Facility size(a) $ 7,500 $ 3,475 $ 800 $ 1,000 $1,200 $ 425 $ 600
Reduction to backstop issuances
Commercial paper(b) (3,138) (1,531) (300) (333) (709) (115) (150)
Outstanding letters of credit (72) (65) (4) (2) (1) — —
Tax-exempt bonds (116) — (35) — — — (81)
Coal ash set-aside(c) (500) — (250) (250) — — —
Available capacity $ 3,674 $ 1,879 $ 211 $ 415 $ 490 $ 310 $ 369
(a) Represents the sublimit of each borrower at December 31, 2015. The Duke Energy Ohio sublimit includes $125 million for Duke Energy Kentucky.
(b) Duke Energy issued $625 million of commercial paper and loaned the proceeds through the money pool to Duke Energy Carolinas, Duke Energy Progress, Duke Energy Ohio and Duke Energy Indiana. The balances are included
within Long-Term Debt Payable to Affiliated Companies in the Consolidated Balance Sheets.
(c) On May 14, 2015, the United States District Court for the Eastern District of North Carolina approved the separate Plea Agreements entered into by Duke Energy Carolinas, Duke Energy Progress and Duke Energy Business
Services, LLC (DEBS), a wholly owned subsidiary of Duke Energy, in connection with the investigation initiated by the USDOJ. Duke Energy Carolinas and Duke Energy Progress are required to each maintain $250 million of
available capacity under the Master Credit Facility as security to meet their obligations under the Plea Agreements, in addition to certain other conditions. See Note 5 to the Consolidated Financial Statements, “Commitments and
Contingencies,” for additional information.