Duke Energy 2015 Annual Report Download - page 58
Download and view the complete annual report
Please find page 58 of the 2015 Duke Energy annual report below. You can navigate through the pages in the report by either clicking on the pages listed below, or by using the keyword search tool below to find specific information within the annual report.-
 1
1 -
2
-
3
-
4
-
5
-
6
-
7
-
8
-
9
-
10
-
11
-
12
-
13
-
14
-
15
-
16
-
17
-
18
-
19
-
20
-
21
-
22
-
23
-
24
-
25
-
26
-
27
-
28
-
29
-
30
-
31
-
32
-
33
-
34
-
35
-
36
-
37
-
38
-
39
-
40
-
41
-
42
-
43
-
44
-
45
-
46
-
47
-
 48
48 -
 49
49 -
 50
50 -
 51
51 -
 52
52 -
 53
53 -
 54
54 -
 55
55 -
 56
56 -
 57
57 -
 58
58 -
 59
59 -
 60
60 -
 61
61 -
 62
62 -
 63
63 -
 64
64 -
 65
65 -
 66
66 -
 67
67 -
 68
68 -
69
-
70
-
71
-
72
-
73
-
74
-
75
-
76
-
77
-
78
-
79
-
80
-
81
-
82
-
83
-
84
-
85
-
86
-
87
-
88
-
89
-
90
-
91
-
92
-
93
-
94
-
95
-
96
-
97
-
98
-
99
-
100
-
101
-
102
-
103
-
104
-
105
-
106
-
107
-
108
-
109
-
110
-
111
-
112
-
113
-
114
-
115
-
116
-
117
-
118
-
119
-
120
-
121
-
122
-
123
-
124
-
125
-
126
-
127
-
128
-
129
-
130
-
131
-
132
-
133
-
134
-
135
-
136
-
137
-
138
-
139
-
140
-
141
-
142
-
143
-
144
-
145
-
146
-
147
-
148
-
149
-
150
-
151
-
152
-
153
-
154
-
155
-
156
-
157
-
158
-
159
-
160
-
161
-
162
-
163
-
164
-
165
-
166
-
167
-
168
-
169
-
170
-
171
-
172
-
173
-
174
-
175
-
176
-
177
-
178
-
179
-
180
-
181
-
182
-
183
-
184
-
185
-
186
-
187
-
188
-
189
-
190
-
191
-
192
-
193
-
194
-
195
-
196
-
197
-
198
-
199
-
200
-
201
-
202
-
203
-
204
-
205
-
206
-
207
-
208
-
209
-
210
-
211
-
212
-
213
-
214
-
215
-
216
-
217
-
218
-
219
-
220
-
221
-
222
-
223
-
224
-
225
-
226
-
227
-
228
-
229
-
230
-
231
-
232
-
233
-
234
-
235
-
236
-
237
-
238
-
239
-
240
-
241
-
242
-
243
-
244
-
245
-
246
-
247
-
248
-
249
-
250
-
251
-
252
-
253
-
254
-
255
-
256
-
257
-
258
-
259
-
260
-
261
-
262
-
263
-
264
 |
 |

38
PART II
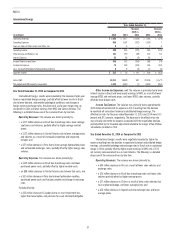
Operating Expenses. The variance was driven primarily by:
• a $75 million increase in Brazil due to higher purchased power as a
result of unfavorable hydrology, partially offset by exchange rates.
Partially offset by:
• a $38 million decrease in Peru as a result of lower purchased power,
transmission, and royalty costs; and
• a $26 million decrease in Argentina due to exchange rates and lower
purchased power and fuel consumption.
Other Income and Expenses, net. The variance is primarily due to a
2013 net currency remeasurement loss in Latin America, higher interest income
in Brazil, and higher equity earnings in NMC as a result of increased MTBE and
methanol sales volumes, partially offset by lower average prices and higher
butane costs.
Income Tax Expense. The variance was primarily due to approximately
$373 million of incremental tax expense in 2014 resulting from the decision to
repatriate all cumulative historical undistributed foreign earnings. The effective
tax rates for the years ended December 31, 2014 and 2013 were 87.3 percent
and 28.3 percent, respectively. The increase in the effective tax rate was also
primarily due to the tax expense associated with the repatriation decision.
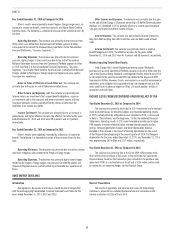
Matters Impacting Future International Energy Results
International Energy’s operations include conventional hydroelectric power
generation facilities located in Brazil where water reservoirs are at abnormally
low levels due to a lack of rainfall. Weather and economic conditions within
Brazil have resulted in higher energy prices, a reduction in electricity demand
and unfavorable impacts to the exchange rate of Brazil’s currency. These
weather and economic conditions have also resulted in lawsuits brought to
the Brazilian courts by certain hydroelectric generators to limit the financial
exposure to the generators. International Energy’s earnings and future cash
flows could continue to be adversely impacted by a further sustained period of
low reservoir levels, a further decline of economic conditions within Brazil, or
from the outcome of legal matters in the Brazilian courts.
International Energy’s equity earnings from NMC reflect sales of methanol
and MTBE, which generate margins that are directionally correlated with crude
oil prices and the recent decline in crude oil prices have reduced the equity
earnings realized from NMC. Continued weakness in the market price of Brent
crude oil and related commodities will likely result in a further decline in equity
earnings from NMC.
On February 18, 2016, Duke Energy announced it had initiated a process
to divest the International Energy business segment, excluding the equity
method investment in NMC. Duke Energy is in the preliminary stage and no
binding or non-binding offers have been requested or submitted. Duke Energy
can provide no assurance that this process will result in a transaction and there
is no specific timeline for execution of a potential transaction. If the potential of
a sale were to progress, it could result in classification of International Energy
as assets held for sale and as a discontinued operation. As of December 31,
2015, the International Energy segment had a carrying value of approximately
$2.7 billion, adjusted to include the cumulative foreign currency translation
losses currently classified as accumulated other comprehensive income.
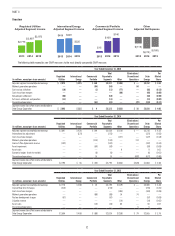
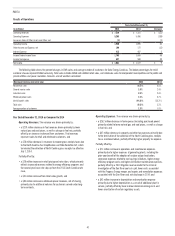
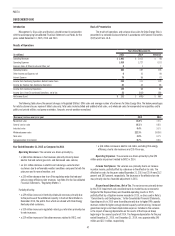
Commercial Portfolio
(in millions)
Years Ended December 31,
2015 2014
Variance
2015 vs.
2014 2013
Variance
2014 vs.
2013
Operating Revenues $ 301 $ 255 $ 46 $ 260 $ (5)
Operating Expenses 353 441 (88) 425 16
Gains (Losses) on Sales of Other Assets and Other, net 1— 1 (23) 23
Operating Loss (51) (186) 135 (188) 2
Other Income and Expense, net 618 (12) 13 5
Interest Expense 44 58 (14) 61 (3)
Loss Before Income Taxes (89) (226) 137 (236) 10
Income Tax Benefit (92) (171) 79 (148) (23)
Less: Loss Attributable to Noncontrolling Interests (1) — (1) — —
Segment Income (Loss) $ 4 $ (55) $ 59 $ (88) $ 33
Coal-fired plant production, GWh —867 (867) 1,644 (777)
Renewable plant production, GWh 5,577 5,462 115 5,111 351
Total Commercial Portfolio production, GWh 5,577 6,329 (752) 6,755 (426)
Net proportional MW capacity in operation 1,943 1,370 573 2,031 (661)
Year Ended December 31, 2015 as Compared to 2014
Commercial Portfolio’s results were positively impacted by the 2014
impairment recorded for an intangible asset and new solar generation, partially
offset by unfavorable wind patterns. The following is a detailed discussion of the
variance drivers by line item.
Operating Revenues. The variance was driven primarily by:
• a $41 million increase in electric revenues due to the acquisition of REC
Solar; and
• a $15 million increase in electric revenues from new solar generation
placed in service.