Duke Energy 2015 Annual Report Download - page 209
Download and view the complete annual report
Please find page 209 of the 2015 Duke Energy annual report below. You can navigate through the pages in the report by either clicking on the pages listed below, or by using the keyword search tool below to find specific information within the annual report.-
 1
1 -
2
-
3
-
4
-
5
-
6
-
7
-
8
-
9
-
10
-
11
-
12
-
13
-
14
-
15
-
16
-
17
-
18
-
19
-
20
-
21
-
22
-
23
-
24
-
25
-
26
-
27
-
28
-
29
-
30
-
31
-
32
-
33
-
34
-
35
-
36
-
37
-
38
-
39
-
40
-
41
-
42
-
43
-
44
-
45
-
46
-
47
-
48
-
49
-
50
-
51
-
52
-
53
-
54
-
55
-
56
-
57
-
58
-
59
-
60
-
61
-
62
-
63
-
64
-
65
-
66
-
67
-
68
-
69
-
70
-
71
-
72
-
73
-
74
-
75
-
76
-
77
-
78
-
79
-
80
-
81
-
82
-
83
-
84
-
85
-
86
-
87
-
88
-
89
-
90
-
91
-
92
-
93
-
94
-
95
-
96
-
97
-
98
-
99
-
100
-
101
-
102
-
103
-
104
-
105
-
106
-
107
-
108
-
109
-
110
-
111
-
112
-
113
-
114
-
115
-
116
-
117
-
118
-
119
-
120
-
121
-
122
-
123
-
124
-
125
-
126
-
127
-
128
-
129
-
130
-
131
-
132
-
133
-
134
-
135
-
136
-
137
-
138
-
139
-
140
-
141
-
142
-
143
-
144
-
145
-
146
-
147
-
148
-
149
-
150
-
151
-
152
-
153
-
154
-
155
-
156
-
157
-
158
-
159
-
160
-
161
-
162
-
163
-
164
-
165
-
166
-
167
-
168
-
169
-
170
-
171
-
172
-
173
-
174
-
175
-
176
-
177
-
178
-
179
-
180
-
181
-
182
-
183
-
184
-
185
-
186
-
187
-
188
-
189
-
190
-
191
-
192
-
193
-
194
-
195
-
196
-
197
-
198
-
 199
199 -
 200
200 -
 201
201 -
 202
202 -
 203
203 -
 204
204 -
 205
205 -
 206
206 -
 207
207 -
 208
208 -
 209
209 -
 210
210 -
 211
211 -
 212
212 -
 213
213 -
 214
214 -
 215
215 -
 216
216 -
 217
217 -
 218
218 -
 219
219 -
220
-
221
-
222
-
223
-
224
-
225
-
226
-
227
-
228
-
229
-
230
-
231
-
232
-
233
-
234
-
235
-
236
-
237
-
238
-
239
-
240
-
241
-
242
-
243
-
244
-
245
-
246
-
247
-
248
-
249
-
250
-
251
-
252
-
253
-
254
-
255
-
256
-
257
-
258
-
259
-
260
-
261
-
262
-
263
-
264
 |
 |

189
PART II
DUKE ENERGY CORPORATION • DUKE ENERGY CAROLINAS, LLC • PROGRESS ENERGY, INC. •
DUKE ENERGY PROGRESS, LLC. • DUKE ENERGY FLORIDA, LLC. • DUKE ENERGY OHIO, INC. • DUKE ENERGY INDIANA, INC.
Combined Notes to Consolidated Financial Statements – (Continued)
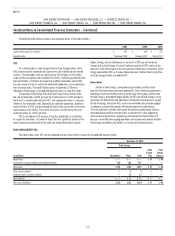
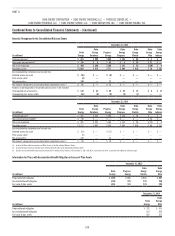
Assumptions Used for Pension Benefits Accounting
The discount rate used to determine the current year pension obligation and following year’s pension expense is based on a bond selection-settlement portfolio
approach. This approach develops a discount rate by selecting a portfolio of high quality corporate bonds that generate sufficient cash flow to provide for projected
benefit payments of the plan. The selected bond portfolio is derived from a universe of non-callable corporate bonds rated Aa quality or higher. After the bond portfolio
is selected, a single interest rate is determined that equates the present value of the plan’s projected benefit payments discounted at this rate with the market value
of the bonds selected.
The average remaining service period of active covered employees is seven years for Duke Energy, Duke Energy Carolinas, Progress Energy, Duke Energy
Progress, Duke Energy Florida, Duke Energy Ohio and Duke Energy Indiana.
The following tables present the assumptions or range of assumptions used for pension benefit accounting.
December 31,
2015 2014 2013
Benefit Obligations
Discount rate 4.40% 4.10 % 4.70%
Salary increase 4.00% - 4.40% 4.00% - 4.40 % 4.00% - 4.40%
Net Periodic Benefit Cost
Discount rate 4.10% 4.70 % 4.10%
Salary increase 4.00% - 4.40% 4.00% - 4.40 % 4.00% - 4.30%
Expected long-term rate of return on plan assets 6.50% 6.75 % 7.75%
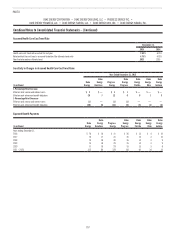
Expected Benefit Payments
(in millions)
Duke
Energy
Duke
Energy
Carolinas
Progress
Energy
Duke
Energy
Progress
Duke
Energy
Florida
Duke
Energy
Ohio
Duke
Energy
Indiana
Years ending December 31,
2016 $ 628 $ 189 $ 164 $ 91 $ 71 $ 35 $ 48
2017 639 199 167 92 73 35 47
2018 640 203 169 92 75 34 47
2019 643 202 171 91 77 34 47
2020 641 201 174 92 80 35 47
2021 – 2025 3,053 906 869 438 420 171 230
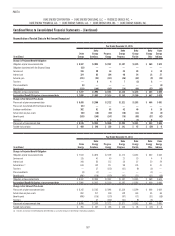
NON-QUALIFIED PENSION PLANS
Components of Net Periodic Pension Costs
Year Ended December 31, 2015
(in millions)
Duke
Energy
Duke
Energy
Carolinas
Progress
Energy
Duke
Energy
Progress
Duke
Energy
Florida
Duke
Energy
Ohio
Duke
Energy
Indiana
Service cost $ 3 $ — $ 1 $ — $ — $ — $ —
Interest cost on projected benefit obligation 13 1 4 1 2 — —
Amortization of actuarial loss 6 — 2 1 2 — 1
Amortization of prior service credit (1) — (1) — — — —
Net periodic pension costs $ 21 $ 1 $ 6 $ 2 $ 4 $ — $ 1