Duke Energy 2015 Annual Report Download - page 114
Download and view the complete annual report
Please find page 114 of the 2015 Duke Energy annual report below. You can navigate through the pages in the report by either clicking on the pages listed below, or by using the keyword search tool below to find specific information within the annual report.-
 1
1 -
2
-
3
-
4
-
5
-
6
-
7
-
8
-
9
-
10
-
11
-
12
-
13
-
14
-
15
-
16
-
17
-
18
-
19
-
20
-
21
-
22
-
23
-
24
-
25
-
26
-
27
-
28
-
29
-
30
-
31
-
32
-
33
-
34
-
35
-
36
-
37
-
38
-
39
-
40
-
41
-
42
-
43
-
44
-
45
-
46
-
47
-
48
-
49
-
50
-
51
-
52
-
53
-
54
-
55
-
56
-
57
-
58
-
59
-
60
-
61
-
62
-
63
-
64
-
65
-
66
-
67
-
68
-
69
-
70
-
71
-
72
-
73
-
74
-
75
-
76
-
77
-
78
-
79
-
80
-
81
-
82
-
83
-
84
-
85
-
86
-
87
-
88
-
89
-
90
-
91
-
92
-
93
-
94
-
95
-
96
-
97
-
98
-
99
-
100
-
101
-
102
-
103
-
 104
104 -
 105
105 -
 106
106 -
 107
107 -
 108
108 -
 109
109 -
 110
110 -
 111
111 -
 112
112 -
 113
113 -
 114
114 -
 115
115 -
 116
116 -
 117
117 -
 118
118 -
 119
119 -
 120
120 -
 121
121 -
 122
122 -
 123
123 -
 124
124 -
125
-
126
-
127
-
128
-
129
-
130
-
131
-
132
-
133
-
134
-
135
-
136
-
137
-
138
-
139
-
140
-
141
-
142
-
143
-
144
-
145
-
146
-
147
-
148
-
149
-
150
-
151
-
152
-
153
-
154
-
155
-
156
-
157
-
158
-
159
-
160
-
161
-
162
-
163
-
164
-
165
-
166
-
167
-
168
-
169
-
170
-
171
-
172
-
173
-
174
-
175
-
176
-
177
-
178
-
179
-
180
-
181
-
182
-
183
-
184
-
185
-
186
-
187
-
188
-
189
-
190
-
191
-
192
-
193
-
194
-
195
-
196
-
197
-
198
-
199
-
200
-
201
-
202
-
203
-
204
-
205
-
206
-
207
-
208
-
209
-
210
-
211
-
212
-
213
-
214
-
215
-
216
-
217
-
218
-
219
-
220
-
221
-
222
-
223
-
224
-
225
-
226
-
227
-
228
-
229
-
230
-
231
-
232
-
233
-
234
-
235
-
236
-
237
-
238
-
239
-
240
-
241
-
242
-
243
-
244
-
245
-
246
-
247
-
248
-
249
-
250
-
251
-
252
-
253
-
254
-
255
-
256
-
257
-
258
-
259
-
260
-
261
-
262
-
263
-
264
 |
 |

94
PART II
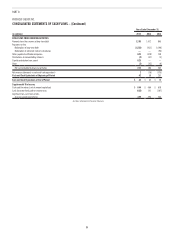
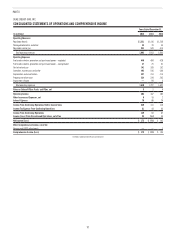
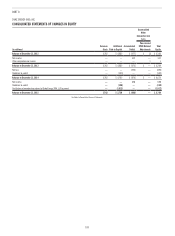
DUKE ENERGY FLORIDA, LLC (formerly DUKE ENERGY FLORIDA, INC.)
CONSOLIDATED STATEMENTS OF CASH FLOWS
Years Ended December 31,
(in millions) 2015 2014 2013
CASH FLOWS FROM OPERATING ACTIVITIES
Net income $ 599 $ 548 $ 325
Adjustments to reconcile net income to net cash provided by operating activities:
Depreciation, amortization and accretion 480 550 335
Equity component of AFUDC (7) — (8)
Gains on sales of other assets and other, net —(1) (1)
Impairment charges 72 358
Deferred income taxes 348 400 368
Accrued pension and other post-retirement benefit costs 529 79
Contributions to qualified pension plans (40) — (133)
Payments for asset retirement obligations (47) (68) (12)
(Increase) decrease in
Net realized and unrealized mark-to-market and hedging transactions (3) (9) 55
Receivables 61 (33) (44)
Receivables from affiliated companies (44) (37) 17
Inventory (17) (36) 42
Other current assets 116 (269) (109)
Increase (decrease) in
Accounts payable (127) 18 (22)
Accounts payable to affiliated companies 46 32 (6)
Taxes accrued 67 (31) 18
Other current liabilities 57 (80) 159
Other assets (84) (59) (154)
Other liabilities (44) 10 (62)
Net cash provided by operating activities 1,373 966 1,205
CASH FLOWS FROM INVESTING ACTIVITIES
Capital expenditures (1,029) (699) (915)
Purchases of available-for-sale securities (447) (1,189) (1,656)
Proceeds from sales and maturities of available-for-sale securities 538 1,195 1,658
Proceeds from the sale of nuclear fuel 102 — —
Notes receivable from affiliated companies —— 207
Other (3) (31) —
Net cash used in investing activities (839) (724) (706)
CASH FLOWS FROM FINANCING ACTIVITIES
Proceeds from the issuance of long-term debt —225 —
Payments for the:
Redemption of long-term debt (562) (252) (435)
Redemption of preferred stock —— (34)
Notes payable to affiliated companies 729 (97) 181
Dividends to parent (350) (124) (325)
Distribution to parent (350) — —
Other (1) (2) (1)
Net cash used in financing activities (534) (250) (614)
Net decrease in cash and cash equivalents —(8) (115)
Cash and Cash Equivalents at Beginning of Period 8 16 131
Cash and Cash Equivalents at End of Period $ 8 $ 8 $ 16
Supplemental Disclosures:
Cash paid for interest, net of amount capitalized $ 205 $ 203 $ 201
Cash (received from) paid for income taxes (229) 59 (84)
Significant non-cash transactions:
Accrued capital expenditures 186 100 88
See Notes to Consolidated Financial Statements