Duke Energy 2015 Annual Report Download - page 178
Download and view the complete annual report
Please find page 178 of the 2015 Duke Energy annual report below. You can navigate through the pages in the report by either clicking on the pages listed below, or by using the keyword search tool below to find specific information within the annual report.-
 1
1 -
2
-
3
-
4
-
5
-
6
-
7
-
8
-
9
-
10
-
11
-
12
-
13
-
14
-
15
-
16
-
17
-
18
-
19
-
20
-
21
-
22
-
23
-
24
-
25
-
26
-
27
-
28
-
29
-
30
-
31
-
32
-
33
-
34
-
35
-
36
-
37
-
38
-
39
-
40
-
41
-
42
-
43
-
44
-
45
-
46
-
47
-
48
-
49
-
50
-
51
-
52
-
53
-
54
-
55
-
56
-
57
-
58
-
59
-
60
-
61
-
62
-
63
-
64
-
65
-
66
-
67
-
68
-
69
-
70
-
71
-
72
-
73
-
74
-
75
-
76
-
77
-
78
-
79
-
80
-
81
-
82
-
83
-
84
-
85
-
86
-
87
-
88
-
89
-
90
-
91
-
92
-
93
-
94
-
95
-
96
-
97
-
98
-
99
-
100
-
101
-
102
-
103
-
104
-
105
-
106
-
107
-
108
-
109
-
110
-
111
-
112
-
113
-
114
-
115
-
116
-
117
-
118
-
119
-
120
-
121
-
122
-
123
-
124
-
125
-
126
-
127
-
128
-
129
-
130
-
131
-
132
-
133
-
134
-
135
-
136
-
137
-
138
-
139
-
140
-
141
-
142
-
143
-
144
-
145
-
146
-
147
-
148
-
149
-
150
-
151
-
152
-
153
-
154
-
155
-
156
-
157
-
158
-
159
-
160
-
161
-
162
-
163
-
164
-
165
-
166
-
167
-
 168
168 -
 169
169 -
 170
170 -
 171
171 -
 172
172 -
 173
173 -
 174
174 -
 175
175 -
 176
176 -
 177
177 -
 178
178 -
 179
179 -
 180
180 -
 181
181 -
 182
182 -
 183
183 -
 184
184 -
 185
185 -
 186
186 -
 187
187 -
 188
188 -
189
-
190
-
191
-
192
-
193
-
194
-
195
-
196
-
197
-
198
-
199
-
200
-
201
-
202
-
203
-
204
-
205
-
206
-
207
-
208
-
209
-
210
-
211
-
212
-
213
-
214
-
215
-
216
-
217
-
218
-
219
-
220
-
221
-
222
-
223
-
224
-
225
-
226
-
227
-
228
-
229
-
230
-
231
-
232
-
233
-
234
-
235
-
236
-
237
-
238
-
239
-
240
-
241
-
242
-
243
-
244
-
245
-
246
-
247
-
248
-
249
-
250
-
251
-
252
-
253
-
254
-
255
-
256
-
257
-
258
-
259
-
260
-
261
-
262
-
263
-
264
 |
 |

158
PART II
DUKE ENERGY CORPORATION • DUKE ENERGY CAROLINAS, LLC • PROGRESS ENERGY, INC. •
DUKE ENERGY PROGRESS, LLC • DUKE ENERGY FLORIDA, LLC • DUKE ENERGY OHIO, INC. • DUKE ENERGY INDIANA, INC.
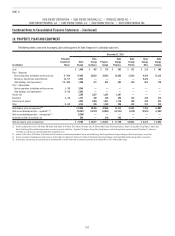
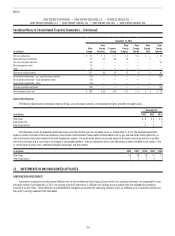
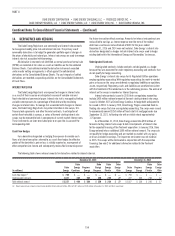
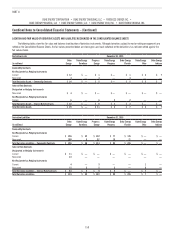
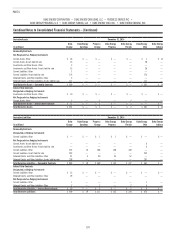
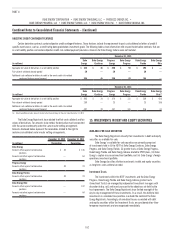
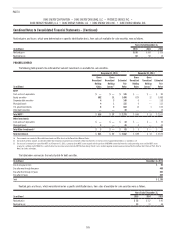
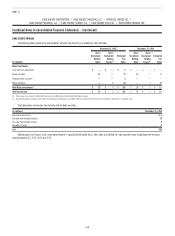
Combined Notes to Consolidated Financial Statements – (Continued)
LOCATION AND FAIR VALUE OF DERIVATIVE ASSETS AND LIABILITIES RECOGNIZED IN THE CONSOLIDATED BALANCE SHEETS
The following tables show the fair value and balance sheet location of derivative instruments. Although derivatives subject to master netting arrangements are
netted on the Consolidated Balance Sheets, the fair values presented below are shown gross and cash collateral on the derivatives has not been netted against the
fair values shown.
Derivative Assets December 31, 2015
(in millions)
Duke
Energy
Duke Energy
Carolinas
Progress
Energy
Duke Energy
Progress
Duke Energy
Florida
Duke Energy
Ohio
Duke Energy
Indiana
Commodity Contracts
Not Designated as Hedging Instruments
Current $ 12 $ — $ 1 $ — $ 1 $ 3 $ 7
Noncurrent 4 — 4 — 4 — —
Total Derivative Assets – Commodity Contracts $ 16 $ — $ 5 $ — $ 5 $ 3 $ 7
Interest Rate Contracts
Designated as Hedging Instruments
Noncurrent $ 4 $ — $ — $ — $ — $ — $ —
Not Designated as Hedging Instruments
Current 6 — 6 2 2 — —
Total Derivative Assets – Interest Rate Contracts $ 10 $ — $ 6 $ 2 $ 2 $ — $ —
Total Derivative Assets $ 26 $ — $ 11 $ 2 $ 7 $ 3 $ 7
Derivative Liabilities December 31, 2015
(in millions)
Duke
Energy
Duke Energy
Carolinas
Progress
Energy
Duke Energy
Progress
Duke Energy
Florida
Duke Energy
Ohio
Duke Energy
Indiana
Commodity Contracts
Not Designated as Hedging Instruments
Current $ 256 $ 32 $ 222 $ 77 $ 145 $ — $ —
Noncurrent 100 8 92 16 71 — —
Total Derivative Liabilities – Commodity Contracts $ 356 $ 40 $ 314 $ 93 $ 216 $ — $ —
Interest Rate Contracts
Designated as Hedging Instruments
Current $ 11 $ — $ — $ — $ — $ — $ —
Noncurrent 33 — — — — — —
Not Designated as Hedging Instruments
Current 4 — 3 — — 1 —
Noncurrent 15 5 5 5 — 6 —
Total Derivative Liabilities – Interest Rate Contracts $ 63 $ 5 $ 8 $ 5 $ — $ 7 $ —
Total Derivative Liabilities $ 419 $ 45 $ 322 $ 98 $ 216 $ 7 $ —