Duke Energy 2015 Annual Report Download - page 91
Download and view the complete annual report
Please find page 91 of the 2015 Duke Energy annual report below. You can navigate through the pages in the report by either clicking on the pages listed below, or by using the keyword search tool below to find specific information within the annual report.-
 1
1 -
2
-
3
-
4
-
5
-
6
-
7
-
8
-
9
-
10
-
11
-
12
-
13
-
14
-
15
-
16
-
17
-
18
-
19
-
20
-
21
-
22
-
23
-
24
-
25
-
26
-
27
-
28
-
29
-
30
-
31
-
32
-
33
-
34
-
35
-
36
-
37
-
38
-
39
-
40
-
41
-
42
-
43
-
44
-
45
-
46
-
47
-
48
-
49
-
50
-
51
-
52
-
53
-
54
-
55
-
56
-
57
-
58
-
59
-
60
-
61
-
62
-
63
-
64
-
65
-
66
-
67
-
68
-
69
-
70
-
71
-
72
-
73
-
74
-
75
-
76
-
77
-
78
-
79
-
80
-
 81
81 -
 82
82 -
 83
83 -
 84
84 -
 85
85 -
 86
86 -
 87
87 -
 88
88 -
 89
89 -
 90
90 -
 91
91 -
 92
92 -
 93
93 -
 94
94 -
 95
95 -
 96
96 -
 97
97 -
 98
98 -
 99
99 -
 100
100 -
 101
101 -
102
-
103
-
104
-
105
-
106
-
107
-
108
-
109
-
110
-
111
-
112
-
113
-
114
-
115
-
116
-
117
-
118
-
119
-
120
-
121
-
122
-
123
-
124
-
125
-
126
-
127
-
128
-
129
-
130
-
131
-
132
-
133
-
134
-
135
-
136
-
137
-
138
-
139
-
140
-
141
-
142
-
143
-
144
-
145
-
146
-
147
-
148
-
149
-
150
-
151
-
152
-
153
-
154
-
155
-
156
-
157
-
158
-
159
-
160
-
161
-
162
-
163
-
164
-
165
-
166
-
167
-
168
-
169
-
170
-
171
-
172
-
173
-
174
-
175
-
176
-
177
-
178
-
179
-
180
-
181
-
182
-
183
-
184
-
185
-
186
-
187
-
188
-
189
-
190
-
191
-
192
-
193
-
194
-
195
-
196
-
197
-
198
-
199
-
200
-
201
-
202
-
203
-
204
-
205
-
206
-
207
-
208
-
209
-
210
-
211
-
212
-
213
-
214
-
215
-
216
-
217
-
218
-
219
-
220
-
221
-
222
-
223
-
224
-
225
-
226
-
227
-
228
-
229
-
230
-
231
-
232
-
233
-
234
-
235
-
236
-
237
-
238
-
239
-
240
-
241
-
242
-
243
-
244
-
245
-
246
-
247
-
248
-
249
-
250
-
251
-
252
-
253
-
254
-
255
-
256
-
257
-
258
-
259
-
260
-
261
-
262
-
263
-
264
 |
 |

71
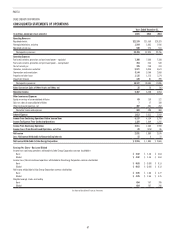
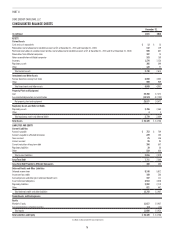
PART II
Years Ended December 31,
(in millions) 2015 2014 2013
CASH FLOWS FROM OPERATING ACTIVITIES
Net income $ 2,831 $ 1,889 $ 2,676
Adjustments to reconcile net income to net cash provided by operating activities:
Depreciation, amortization and accretion (including amortization of nuclear fuel) 3,613 3,507 3,229
Equity component of AFUDC (164) (135) (157)
FERC mitigation costs —(15) —
Community support and charitable contributions expense —— 34
Gains on sales of other assets (48) (33) (79)
Impairment charges 153 915 400
Deferred income taxes 1,244 1,149 1,264
Equity in earnings of unconsolidated affiliates (69) (130) (122)
Accrued pension and other post-retirement benefit costs 71 108 307
Contributions to qualified pension plans (302) — (250)
Payments for asset retirement obligations (346) (68) (12)
(Increase) decrease in
Net realized and unrealized mark-to-market and hedging transactions (29) 44 1
Receivables 359 58 (281)
Inventory (237) (269) (31)
Other current assets (65) (414) (35)
Increase (decrease) in
Accounts payable (6) (30) 73
Taxes accrued (38) (14) 77
Other current liabilities 168 (201) 24
Other assets (216) 16 (384)
Other liabilities (243) 209 (352)
Net cash provided by operating activities 6,676 6,586 6,382
CASH FLOWS FROM INVESTING ACTIVITIES
Capital expenditures (6,766) (5,384) (5,526)
Investment expenditures (263) (90) (81)
Acquisitions, net of cash acquired (1,334) (54) —
Purchases of available-for-sale securities (4,037) (4,110) (6,142)
Proceeds from sales and maturities of available-for-sale securities 4,040 4,133 6,315
Net proceeds from the sale of Midwest generation business and sales of equity investments and other assets 2,968 179 277
Change in restricted cash 191 9 167
Other (76) (56) 12
Net cash used in investing activities (5,277) (5,373) (4,978)
See Notes to Consolidated Financial Statements
DUKE ENERGY CORPORATION
CONSOLIDATED STATEMENTS OF CASH FLOWS