Duke Energy 2015 Annual Report Download - page 77
Download and view the complete annual report
Please find page 77 of the 2015 Duke Energy annual report below. You can navigate through the pages in the report by either clicking on the pages listed below, or by using the keyword search tool below to find specific information within the annual report.-
 1
1 -
2
-
3
-
4
-
5
-
6
-
7
-
8
-
9
-
10
-
11
-
12
-
13
-
14
-
15
-
16
-
17
-
18
-
19
-
20
-
21
-
22
-
23
-
24
-
25
-
26
-
27
-
28
-
29
-
30
-
31
-
32
-
33
-
34
-
35
-
36
-
37
-
38
-
39
-
40
-
41
-
42
-
43
-
44
-
45
-
46
-
47
-
48
-
49
-
50
-
51
-
52
-
53
-
54
-
55
-
56
-
57
-
58
-
59
-
60
-
61
-
62
-
63
-
64
-
65
-
66
-
 67
67 -
 68
68 -
 69
69 -
 70
70 -
 71
71 -
 72
72 -
 73
73 -
 74
74 -
 75
75 -
 76
76 -
 77
77 -
 78
78 -
 79
79 -
 80
80 -
 81
81 -
 82
82 -
 83
83 -
 84
84 -
 85
85 -
 86
86 -
 87
87 -
88
-
89
-
90
-
91
-
92
-
93
-
94
-
95
-
96
-
97
-
98
-
99
-
100
-
101
-
102
-
103
-
104
-
105
-
106
-
107
-
108
-
109
-
110
-
111
-
112
-
113
-
114
-
115
-
116
-
117
-
118
-
119
-
120
-
121
-
122
-
123
-
124
-
125
-
126
-
127
-
128
-
129
-
130
-
131
-
132
-
133
-
134
-
135
-
136
-
137
-
138
-
139
-
140
-
141
-
142
-
143
-
144
-
145
-
146
-
147
-
148
-
149
-
150
-
151
-
152
-
153
-
154
-
155
-
156
-
157
-
158
-
159
-
160
-
161
-
162
-
163
-
164
-
165
-
166
-
167
-
168
-
169
-
170
-
171
-
172
-
173
-
174
-
175
-
176
-
177
-
178
-
179
-
180
-
181
-
182
-
183
-
184
-
185
-
186
-
187
-
188
-
189
-
190
-
191
-
192
-
193
-
194
-
195
-
196
-
197
-
198
-
199
-
200
-
201
-
202
-
203
-
204
-
205
-
206
-
207
-
208
-
209
-
210
-
211
-
212
-
213
-
214
-
215
-
216
-
217
-
218
-
219
-
220
-
221
-
222
-
223
-
224
-
225
-
226
-
227
-
228
-
229
-
230
-
231
-
232
-
233
-
234
-
235
-
236
-
237
-
238
-
239
-
240
-
241
-
242
-
243
-
244
-
245
-
246
-
247
-
248
-
249
-
250
-
251
-
252
-
253
-
254
-
255
-
256
-
257
-
258
-
259
-
260
-
261
-
262
-
263
-
264
 |
 |

57
PART II
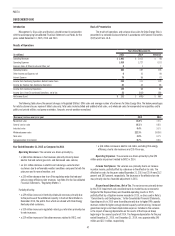
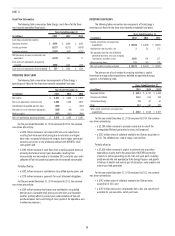
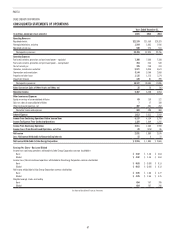
FINANCING CASH FLOWS
The following table summarizes key components of Duke Energy’s
financing cash flows for the three most recently completed fiscal years.
Years Ended December 31,
(in millions) 2015 2014 2013
Issuance of common stock related to employee benefit
plans $ 17 $ 25 $ 9
(Repayments) Issuances of long-term debt, net (74) (123) 840
Notes payable and commercial paper 1,245 1,688 93
Dividends paid (2,254) (2,234) (2,188)
Repurchase of common shares (1,500) — —
Other financing items (12) (34) (81)
Net cash used in financing activities $(2,578) $ (678) $(1,327)
For the year ended December 31, 2015 compared to 2014, the variance
was driven primarily by:
• a $1,500 million increase in cash outflows due to the repurchase of
19.8 million common shares under the ASR and
• a $443 million decrease in proceeds from net issuances of notes
payable and commercial paper, primarily due to prior year financing
with short-term debt in advance of the 2015 receipt of proceeds from
the sale of the nonregulated Midwest generation business to Dynegy,
net of current year financing with short-term debt used to repay long-
term debt maturities at Duke Energy Florida in advance of the 2016
proceeds from the proposed issuance of securitization bonds related to
Crystal River Unit 3.
For the year ended December 31, 2014 compared to 2013, the variance
was driven primarily by:
• a $1,595 million increase in proceeds from net issuances of notes
payable and commercial paper, primarily due to funding a larger
proportion of total financing needs with short-term debt in advance of
the receipt in 2015 of proceeds from the sale of the Midwest Generation
business.
Partially offset by:
• a $963 million decrease in net issuances of long-term debt, primarily
due to funding a larger proportion of total financing needs with short-
term debt in 2014 than in 2013.
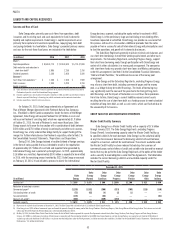
Summary of Significant Debt Issuances
Year Ended December 31, 2015
Issuance Date
Maturity
Date
Interest
Rate
Duke
Energy
Duke
Energy
(Parent)
Duke
Energy
Carolinas
Duke
Energy
Progress
Unsecured Debt
November 2015(a)(b) April 2024 3.750% $ 400 $ 400 $ — $ —
November 2015(a)(b) December 2045 4.800% 600 600 — —
First Mortgage Bonds
March 2015(c) June 2045 3.750% 500 — 500 —
August 2015(a)(d) August 2025 3.250% 500 — — 500
August 2015(a)(d) August 2045 4.200% 700 — — 700
Total issuances $ 2,700 $ 1,000 $ 500 $ 1,200
(a) Proceeds were used to repay short-term money pool and commercial paper borrowing issued to fund a portion of the NCEMPA acquisition, see Note 2 to the Consolidated Financial Statements, “Acquisitions, Dispositions and
Sales of Other Assets”, for further information.
(b) Proceeds were used to refinance at maturity $300 million of unsecured notes at Progress Energy due January 2016.
(c) Proceeds were used to redeem at maturity $500 million of first mortgage bonds due October 2015.
(d) Proceeds were used to refinance at maturity $400 million of first mortgage bonds due December 2015.