Duke Energy 2015 Annual Report Download - page 68
Download and view the complete annual report
Please find page 68 of the 2015 Duke Energy annual report below. You can navigate through the pages in the report by either clicking on the pages listed below, or by using the keyword search tool below to find specific information within the annual report.-
 1
1 -
2
-
3
-
4
-
5
-
6
-
7
-
8
-
9
-
10
-
11
-
12
-
13
-
14
-
15
-
16
-
17
-
18
-
19
-
20
-
21
-
22
-
23
-
24
-
25
-
26
-
27
-
28
-
29
-
30
-
31
-
32
-
33
-
34
-
35
-
36
-
37
-
38
-
39
-
40
-
41
-
42
-
43
-
44
-
45
-
46
-
47
-
48
-
49
-
50
-
51
-
52
-
53
-
54
-
55
-
56
-
57
-
 58
58 -
 59
59 -
 60
60 -
 61
61 -
 62
62 -
 63
63 -
 64
64 -
 65
65 -
 66
66 -
 67
67 -
 68
68 -
 69
69 -
 70
70 -
 71
71 -
 72
72 -
 73
73 -
 74
74 -
 75
75 -
 76
76 -
 77
77 -
 78
78 -
79
-
80
-
81
-
82
-
83
-
84
-
85
-
86
-
87
-
88
-
89
-
90
-
91
-
92
-
93
-
94
-
95
-
96
-
97
-
98
-
99
-
100
-
101
-
102
-
103
-
104
-
105
-
106
-
107
-
108
-
109
-
110
-
111
-
112
-
113
-
114
-
115
-
116
-
117
-
118
-
119
-
120
-
121
-
122
-
123
-
124
-
125
-
126
-
127
-
128
-
129
-
130
-
131
-
132
-
133
-
134
-
135
-
136
-
137
-
138
-
139
-
140
-
141
-
142
-
143
-
144
-
145
-
146
-
147
-
148
-
149
-
150
-
151
-
152
-
153
-
154
-
155
-
156
-
157
-
158
-
159
-
160
-
161
-
162
-
163
-
164
-
165
-
166
-
167
-
168
-
169
-
170
-
171
-
172
-
173
-
174
-
175
-
176
-
177
-
178
-
179
-
180
-
181
-
182
-
183
-
184
-
185
-
186
-
187
-
188
-
189
-
190
-
191
-
192
-
193
-
194
-
195
-
196
-
197
-
198
-
199
-
200
-
201
-
202
-
203
-
204
-
205
-
206
-
207
-
208
-
209
-
210
-
211
-
212
-
213
-
214
-
215
-
216
-
217
-
218
-
219
-
220
-
221
-
222
-
223
-
224
-
225
-
226
-
227
-
228
-
229
-
230
-
231
-
232
-
233
-
234
-
235
-
236
-
237
-
238
-
239
-
240
-
241
-
242
-
243
-
244
-
245
-
246
-
247
-
248
-
249
-
250
-
251
-
252
-
253
-
254
-
255
-
256
-
257
-
258
-
259
-
260
-
261
-
262
-
263
-
264
 |
 |

48
PART II
Matters Impacting Future Results
In 2013, a FERC ALJ issued an initial decision that Duke Energy Ohio
is responsible for costs associated with certain MVP costs, a type of MTEP
cost, approved by MISO prior to the date of Duke Energy Ohio’s withdrawal. On
October 29, 2015, the FERC issued an order reversing the ALJ’s decision. FERC
ruled that Duke Energy Ohio has no liability for MVP costs after its withdrawal
from MISO. On November 30, 2015, MISO filed with the FERC a request for
rehearing. If Duke Energy Ohio is deemed responsible for these costs upon
appeal, and if the regulatory commissions disallow recovery of these costs,
there would be an adverse impact to Duke Energy Ohio’s financial position,
results of operations and cash flows. See Note 4 to the Consolidated Financial
Statements, “Regulatory Matters,” for additional information.
An order from regulatory authorities disallowing recovery of costs related
to closure of ash basins could have an adverse impact on Duke Energy Ohio’s
financial position, results of operations and cash flows. See Notes 4 and 9 to the
Consolidated Financial Statements, “Regulatory Matters” and “Asset Retirement
Obligations,” respectively, for additional information.
Duke Energy Ohio’s nonregulated Beckjord station, a facility retired during
2014, is not subject to the recently enacted EPA rule related to the disposal
of CCR from electric utilities. However, if costs are incurred as a result of
environmental regulations or to mitigate risk associated with on-site storage of
coal ash at the facility, the costs could have an adverse impact on Duke Energy
Ohio’s financial position, results of operations and cash flows.
On October 23, 2015, the EPA published in the Federal Register the
CPP rule for regulating CO2 emissions from existing fossil fuel-fired EGUs. The
CPP establishes CO2 emission rates and mass cap goals that apply to fossil
fuel-fired generation. Under the CPP, states are required to develop and submit
a final compliance plan, or an initial plan with an extension request, to the EPA
by September 6, 2016, or no later than September 6, 2018, with an approved
extension. These state plans are subject to EPA approval, with a federal plan
applied to states that fail to submit a plan to the EPA or if a state plan is
not approved. Legal challenges to the CPP have been filed by stakeholders
and motions to stay the requirements of the rule pending the outcome of the
litigation have been filed. The U.S. Supreme Court granted a Motion to Stay in
February 2016, effectively blocking enforcement of the rule until legal challenges
are resolved. Final resolution of these legal challenges could take several years.
Compliance with CPP could cause the industry to replace coal generation with
natural gas and renewables, especially in states that have significant CO2
reduction targets under the rule. Costs to operate coal-fired generation plants
continue to grow due to increasing environmental compliance requirements,
including ash management costs unrelated to CPP, and this may result in the
retirement of coal-fired generation plants earlier than the current useful lives.
Duke Energy Ohio continues to evaluate the need to retire generating facilities
and plans to seek regulatory recovery, where appropriate, for amounts that have
not been recovered upon asset retirements. However, recovery is subject to
future regulatory approval, including the recovery of carrying costs on remaining
book values, and therefore cannot be assured. In addition, Duke Energy Ohio
could incur increased fuel, purchased power, operation and maintenance, and
other costs for replacement generation as a result of this rule. Duke Energy Ohio
cannot predict the outcome of these matters.
DUKE ENERGY INDIANA
Introduction
Management’s Discussion and Analysis should be read in conjunction
with the accompanying Consolidated Financial Statements and Notes for the
years ended December 31, 2015, 2014 and 2013.
Basis of Presentation
The results of operations and variance discussion for Duke Energy
Indiana is presented in a reduced disclosure format in accordance with General
Instruction (I)(2)(a) of Form 10-K.
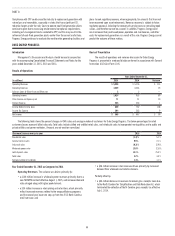
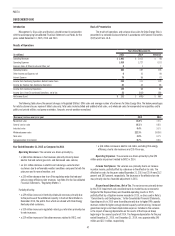
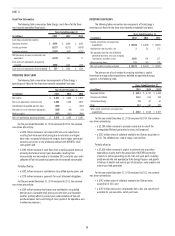
Results of Operations
Years Ended December 31,
(in millions) 2015 2014 Variance
Operating Revenues $ 2,890 $ 3,175 $ (285)
Operating Expenses 2,247 2,470 (223)
Gains on Sales of Other Assets and Other, net 1— 1
Operating Income 644 705 (61)
Other Income and Expense, net 11 22 (11)
Interest Expense 176 171 5
Income Before Income Taxes 479 556 (77)
Income Tax Expense 163 197 (34)
Net Income $ 316 $ 359 $ (43)
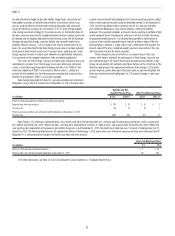
The following table shows the percent changes in GWh sales and average number of customers for Duke Energy Indiana. The below percentages for retail
customer classes represent billed sales only. Total sales includes billed and unbilled retail sales, and wholesale sales to incorporated municipalities and to public and
private utilities and power marketers. Amounts are not weather normalized.
(Decrease) increase over prior year 2015 2014
Residential sales (4.1)% 2.1%
General service sales (0.5)% —%
Industrial sales (1.4)% 2.5%
Wholesale power sales 9.4% (8.8)%
Total sales 0.3% (0.8)%
Average number of customers 0.8% 0.6%