Duke Energy 2015 Annual Report Download - page 173
Download and view the complete annual report
Please find page 173 of the 2015 Duke Energy annual report below. You can navigate through the pages in the report by either clicking on the pages listed below, or by using the keyword search tool below to find specific information within the annual report.-
 1
1 -
2
-
3
-
4
-
5
-
6
-
7
-
8
-
9
-
10
-
11
-
12
-
13
-
14
-
15
-
16
-
17
-
18
-
19
-
20
-
21
-
22
-
23
-
24
-
25
-
26
-
27
-
28
-
29
-
30
-
31
-
32
-
33
-
34
-
35
-
36
-
37
-
38
-
39
-
40
-
41
-
42
-
43
-
44
-
45
-
46
-
47
-
48
-
49
-
50
-
51
-
52
-
53
-
54
-
55
-
56
-
57
-
58
-
59
-
60
-
61
-
62
-
63
-
64
-
65
-
66
-
67
-
68
-
69
-
70
-
71
-
72
-
73
-
74
-
75
-
76
-
77
-
78
-
79
-
80
-
81
-
82
-
83
-
84
-
85
-
86
-
87
-
88
-
89
-
90
-
91
-
92
-
93
-
94
-
95
-
96
-
97
-
98
-
99
-
100
-
101
-
102
-
103
-
104
-
105
-
106
-
107
-
108
-
109
-
110
-
111
-
112
-
113
-
114
-
115
-
116
-
117
-
118
-
119
-
120
-
121
-
122
-
123
-
124
-
125
-
126
-
127
-
128
-
129
-
130
-
131
-
132
-
133
-
134
-
135
-
136
-
137
-
138
-
139
-
140
-
141
-
142
-
143
-
144
-
145
-
146
-
147
-
148
-
149
-
150
-
151
-
152
-
153
-
154
-
155
-
156
-
157
-
158
-
159
-
160
-
161
-
162
-
 163
163 -
 164
164 -
 165
165 -
 166
166 -
 167
167 -
 168
168 -
 169
169 -
 170
170 -
 171
171 -
 172
172 -
 173
173 -
 174
174 -
 175
175 -
 176
176 -
 177
177 -
 178
178 -
 179
179 -
 180
180 -
 181
181 -
 182
182 -
 183
183 -
184
-
185
-
186
-
187
-
188
-
189
-
190
-
191
-
192
-
193
-
194
-
195
-
196
-
197
-
198
-
199
-
200
-
201
-
202
-
203
-
204
-
205
-
206
-
207
-
208
-
209
-
210
-
211
-
212
-
213
-
214
-
215
-
216
-
217
-
218
-
219
-
220
-
221
-
222
-
223
-
224
-
225
-
226
-
227
-
228
-
229
-
230
-
231
-
232
-
233
-
234
-
235
-
236
-
237
-
238
-
239
-
240
-
241
-
242
-
243
-
244
-
245
-
246
-
247
-
248
-
249
-
250
-
251
-
252
-
253
-
254
-
255
-
256
-
257
-
258
-
259
-
260
-
261
-
262
-
263
-
264
 |
 |

153
PART II
DUKE ENERGY CORPORATION • DUKE ENERGY CAROLINAS, LLC • PROGRESS ENERGY, INC. •
DUKE ENERGY PROGRESS, LLC • DUKE ENERGY FLORIDA, LLC • DUKE ENERGY OHIO, INC. • DUKE ENERGY INDIANA, INC.
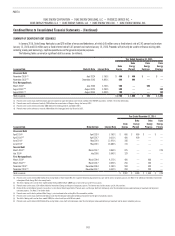
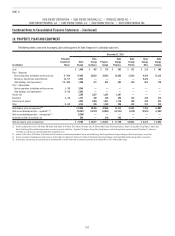
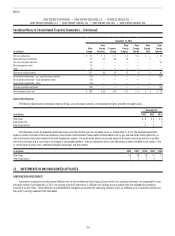
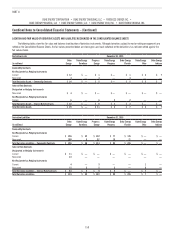
Combined Notes to Consolidated Financial Statements – (Continued)
December 31, 2014
(in millions)
Duke
Energy
Duke
Energy
Carolinas
Progress
Energy
Duke
Energy
Progress
Duke
Energy
Florida
Duke
Energy
Ohio
Duke
Energy
Indiana
Emission allowances $ 23 $ 1 $ 7 $ 3 $ 4 $ — $ 16
Renewable energy certificates 97 25 69 69 — 3 —
Gas, coal and power contracts 24 — — — — — 24
Wind development rights 97 — — — — — —
Other 76 — — — — — —
Total gross carrying amounts 317 26 76 72 4 3 40
Accumulated amortization – gas, coal and power contracts (15) — — — — — (15)
Accumulated amortization – wind development rights (14) — — — — — —
Accumulated amortization – other (25) — — — — — —
Total accumulated amortization (54) — — — — — (15)
Total intangible assets, net $ 263 $ 26 $ 76 $ 72 $ 4 $ 3 $ 25
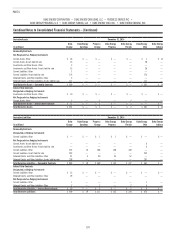
Amortization Expense
The following table presents amortization expense for gas, coal and power contracts, wind development rights and other intangible assets.
December 31,
(in millions) 2015 2014 2013
Duke Energy $ 4 $ 6 $ 13
Duke Energy Ohio —2 8
Duke Energy Indiana 11 1
The table below shows the expected amortization expense for the next five years for intangible assets as of December 31, 2015. The expected amortization
expense includes estimates of emission allowances consumption and estimates of consumption of commodities such as gas and coal under existing contracts, as
well as estimated amortization related to the wind development projects. The amortization amounts discussed below are estimates and actual amounts may differ
from these estimates due to such factors as changes in consumption patterns, sales or impairments of emission allowances or other intangible assets, delays in the
in-service dates of wind assets, additional intangible acquisitions and other events.
(in millions) 2016 2017 2018 2019 2020
Duke Energy $ 8 $8 $8 $7 $7
Duke Energy Indiana 2 2 2 2 2
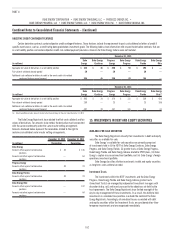
12. INVESTMENTS IN UNCONSOLIDATED AFFILIATES
EQUITY METHOD INVESTMENTS
Investments in domestic and international affiliates that are not controlled by Duke Energy, but over which it has significant influence, are accounted for using
the equity method. As of December 31, 2015, the carrying amount of investments in affiliates with carrying amounts greater than zero exceeded the underlying
investment by $60 million. These differences are attributable to intangibles associated with underlying contracts which are reflected in the investments balance and
the equity in earnings reported in the table below.