Duke Energy 2015 Annual Report Download - page 202
Download and view the complete annual report
Please find page 202 of the 2015 Duke Energy annual report below. You can navigate through the pages in the report by either clicking on the pages listed below, or by using the keyword search tool below to find specific information within the annual report.-
 1
1 -
2
-
3
-
4
-
5
-
6
-
7
-
8
-
9
-
10
-
11
-
12
-
13
-
14
-
15
-
16
-
17
-
18
-
19
-
20
-
21
-
22
-
23
-
24
-
25
-
26
-
27
-
28
-
29
-
30
-
31
-
32
-
33
-
34
-
35
-
36
-
37
-
38
-
39
-
40
-
41
-
42
-
43
-
44
-
45
-
46
-
47
-
48
-
49
-
50
-
51
-
52
-
53
-
54
-
55
-
56
-
57
-
58
-
59
-
60
-
61
-
62
-
63
-
64
-
65
-
66
-
67
-
68
-
69
-
70
-
71
-
72
-
73
-
74
-
75
-
76
-
77
-
78
-
79
-
80
-
81
-
82
-
83
-
84
-
85
-
86
-
87
-
88
-
89
-
90
-
91
-
92
-
93
-
94
-
95
-
96
-
97
-
98
-
99
-
100
-
101
-
102
-
103
-
104
-
105
-
106
-
107
-
108
-
109
-
110
-
111
-
112
-
113
-
114
-
115
-
116
-
117
-
118
-
119
-
120
-
121
-
122
-
123
-
124
-
125
-
126
-
127
-
128
-
129
-
130
-
131
-
132
-
133
-
134
-
135
-
136
-
137
-
138
-
139
-
140
-
141
-
142
-
143
-
144
-
145
-
146
-
147
-
148
-
149
-
150
-
151
-
152
-
153
-
154
-
155
-
156
-
157
-
158
-
159
-
160
-
161
-
162
-
163
-
164
-
165
-
166
-
167
-
168
-
169
-
170
-
171
-
172
-
173
-
174
-
175
-
176
-
177
-
178
-
179
-
180
-
181
-
182
-
183
-
184
-
185
-
186
-
187
-
188
-
189
-
190
-
191
-
 192
192 -
 193
193 -
 194
194 -
 195
195 -
 196
196 -
 197
197 -
 198
198 -
 199
199 -
 200
200 -
 201
201 -
 202
202 -
 203
203 -
 204
204 -
 205
205 -
 206
206 -
 207
207 -
 208
208 -
 209
209 -
 210
210 -
 211
211 -
 212
212 -
213
-
214
-
215
-
216
-
217
-
218
-
219
-
220
-
221
-
222
-
223
-
224
-
225
-
226
-
227
-
228
-
229
-
230
-
231
-
232
-
233
-
234
-
235
-
236
-
237
-
238
-
239
-
240
-
241
-
242
-
243
-
244
-
245
-
246
-
247
-
248
-
249
-
250
-
251
-
252
-
253
-
254
-
255
-
256
-
257
-
258
-
259
-
260
-
261
-
262
-
263
-
264
 |
 |

182
PART II
DUKE ENERGY CORPORATION • DUKE ENERGY CAROLINAS, LLC • PROGRESS ENERGY, INC. •
DUKE ENERGY PROGRESS, LLC. • DUKE ENERGY FLORIDA, LLC. • DUKE ENERGY OHIO, INC. • DUKE ENERGY INDIANA, INC.
Combined Notes to Consolidated Financial Statements – (Continued)
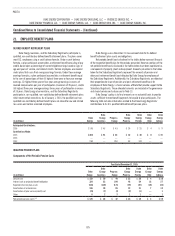
The following table presents Duke Energy’s basic and diluted EPS calculations and reconciles the weighted average number of common stock outstanding to the
diluted weighted average number of common stock outstanding.
Years Ended December 31,
(in millions, except per share amounts) 2015 2014 2013
Income from continuing operations attributable to Duke Energy common stockholders excluding impact of participating securities $2,791 $2,446 $2,565
Weighted average shares outstanding – basic 694 707 706
Weighted average shares outstanding – diluted 694 707 706
Earnings per share from continuing operations attributable to Duke Energy common stockholders
Basic $ 4.02 $ 3.46 $ 3.64
Diluted $ 4.02 $ 3.46 $ 3.63
Potentially dilutive items excluded from the calculation(a) 22 2
Dividends declared per common share $ 3.24 $ 3.15 $ 3.09
(a) Performance stock awards and certain stock options were not included in the dilutive securities calculation because either the performance measures related to the awards had not been met or the option exercise prices were
greater than the average market price of the common shares during the presented periods.
On April 6, 2015, Duke Energy entered into agreements with each of Goldman, Sachs & Co. and JPMorgan Chase Bank, National Association (the Dealers) to
repurchase a total of $1.5 billion of Duke Energy common stock under an accelerated stock repurchase program (the ASR). Duke Energy made payments of $750
million to each of the Dealers and was delivered 16.6 million shares, with a total fair value of $1.275 billion, which represented approximately 85 percent of the total
number of shares of Duke Energy common stock expected to be repurchased under the ASR. The $225 million unsettled portion met the criteria to be accounted for as
a forward contract indexed to Duke Energy’s stock and qualified as an equity instrument. The company recorded the $1.5 billion payment as a reduction to common
stock as of April 6, 2015. In June 2015, the Dealers delivered 3.2 million additional shares to Duke Energy to complete the ASR. Approximately 19.8 million shares, in
total, were delivered to Duke Energy and retired under the ASR at an average price of $75.75 per share. The final number of shares repurchased was based upon the
average of the daily volume weighted average stock prices of Duke Energy’s common stock during the term of the program, less a discount.
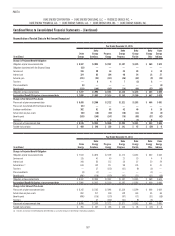
19. SEVERANCE
During 2015, Duke Energy developed targeted cost savings initiatives aimed at reducing operating and maintenance expense. The initiatives include efforts
to reduce costs through standardization of processes and systems, leveraging technology and workforce optimization throughout the company in order to achieve
sustainable cost reductions. In conjunction with these initiatives, voluntary and involuntary severance benefits were extended to a total of approximately 900
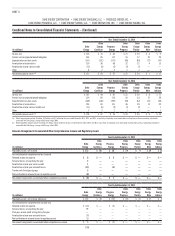
employees. The following table presents the direct and allocated severance and related expenses recorded by the Duke Energy Registrants associated with these
initiatives. Amounts are included within Operation, maintenance and other on the Consolidated Statements of Operations.
(in millions)
Duke
Energy
Duke
Energy
Carolinas
Progress
Energy
Duke
Energy
Progress
Duke
Energy
Florida
Duke
Energy
Ohio
Duke
Energy
Indiana
Year Ended December 31, 2015 $ 142 $ 93 $ 36 $ 28 $ 8 $ 2 $ 6
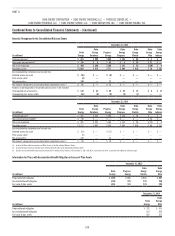
In conjunction with the 2012 merger with Progress Energy, Duke Energy and Progress Energy offered a voluntary severance plan to certain eligible employees.
As of December 31, 2015, all plan participants have separated from the company. The following table presents direct and allocated severance and related expenses
recorded by the Duke Energy Registrants associated with this plan. Amounts are included within Operation, maintenance and other on the Consolidated Statements of
Operations. Amounts for 2014 and 2015 were not material.
(in millions)
Duke
Energy(a)
Duke
Energy
Carolinas
Progress
Energy
Duke
Energy
Progress
Duke
Energy
Florida
Duke
Energy
Ohio
Duke
Energy
Indiana
Year Ended December 31, 2013 $ 34 $ 8 $ 19 $ 14 $ 5 $ 2 $ 2
(a) Includes $5 million of accelerated stock award expense and $2 million of COBRA and health care reimbursement expense.
During 2013, in conjunction with the retirement of Crystal River Unit 3, severance benefits were made available to certain impacted unionized and non-
unionized employees, to the extent that those employees did not find job opportunities at other locations. For the year ended December 31, 2013, Duke Energy Florida
deferred $26 million of severance costs as a regulatory asset. Severance costs accrued in 2014 and 2015 related to this plan were not material. As of December 31,
2015, all plan participants have separated from the company. Refer to Note 4 for further discussion regarding Crystal River Unit 3.