Duke Energy 2015 Annual Report Download - page 159
Download and view the complete annual report
Please find page 159 of the 2015 Duke Energy annual report below. You can navigate through the pages in the report by either clicking on the pages listed below, or by using the keyword search tool below to find specific information within the annual report.-
 1
1 -
2
-
3
-
4
-
5
-
6
-
7
-
8
-
9
-
10
-
11
-
12
-
13
-
14
-
15
-
16
-
17
-
18
-
19
-
20
-
21
-
22
-
23
-
24
-
25
-
26
-
27
-
28
-
29
-
30
-
31
-
32
-
33
-
34
-
35
-
36
-
37
-
38
-
39
-
40
-
41
-
42
-
43
-
44
-
45
-
46
-
47
-
48
-
49
-
50
-
51
-
52
-
53
-
54
-
55
-
56
-
57
-
58
-
59
-
60
-
61
-
62
-
63
-
64
-
65
-
66
-
67
-
68
-
69
-
70
-
71
-
72
-
73
-
74
-
75
-
76
-
77
-
78
-
79
-
80
-
81
-
82
-
83
-
84
-
85
-
86
-
87
-
88
-
89
-
90
-
91
-
92
-
93
-
94
-
95
-
96
-
97
-
98
-
99
-
100
-
101
-
102
-
103
-
104
-
105
-
106
-
107
-
108
-
109
-
110
-
111
-
112
-
113
-
114
-
115
-
116
-
117
-
118
-
119
-
120
-
121
-
122
-
123
-
124
-
125
-
126
-
127
-
128
-
129
-
130
-
131
-
132
-
133
-
134
-
135
-
136
-
137
-
138
-
139
-
140
-
141
-
142
-
143
-
144
-
145
-
146
-
147
-
148
-
 149
149 -
 150
150 -
 151
151 -
 152
152 -
 153
153 -
 154
154 -
 155
155 -
 156
156 -
 157
157 -
 158
158 -
 159
159 -
 160
160 -
 161
161 -
 162
162 -
 163
163 -
 164
164 -
 165
165 -
 166
166 -
 167
167 -
 168
168 -
 169
169 -
170
-
171
-
172
-
173
-
174
-
175
-
176
-
177
-
178
-
179
-
180
-
181
-
182
-
183
-
184
-
185
-
186
-
187
-
188
-
189
-
190
-
191
-
192
-
193
-
194
-
195
-
196
-
197
-
198
-
199
-
200
-
201
-
202
-
203
-
204
-
205
-
206
-
207
-
208
-
209
-
210
-
211
-
212
-
213
-
214
-
215
-
216
-
217
-
218
-
219
-
220
-
221
-
222
-
223
-
224
-
225
-
226
-
227
-
228
-
229
-
230
-
231
-
232
-
233
-
234
-
235
-
236
-
237
-
238
-
239
-
240
-
241
-
242
-
243
-
244
-
245
-
246
-
247
-
248
-
249
-
250
-
251
-
252
-
253
-
254
-
255
-
256
-
257
-
258
-
259
-
260
-
261
-
262
-
263
-
264
 |
 |

139
PART II
DUKE ENERGY CORPORATION • DUKE ENERGY CAROLINAS, LLC • PROGRESS ENERGY, INC. •
DUKE ENERGY PROGRESS, LLC • DUKE ENERGY FLORIDA, LLC • DUKE ENERGY OHIO, INC. • DUKE ENERGY INDIANA, INC.
Combined Notes to Consolidated Financial Statements – (Continued)
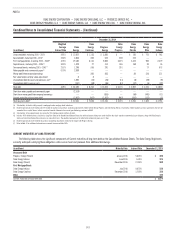
The table below presents recorded reserves based on management’s best
estimate of probable loss for legal matters, excluding asbestos-related reserves
and the exit obligation discussed above related to the termination of an EPC
contract. Reserves are classified on the Consolidated Balance Sheets in Other
within Deferred Credits and Other Liabilities and Accounts payable and Other
within Current Liabilities. The reasonably possible range of loss in excess of
recorded reserves is not material, other than as described above.
December 31,
(in millions) 2015 2014
Reserves for Legal Matters
Duke Energy $166 $ 323
Duke Energy Carolinas 11 72
Progress Energy 54 93
Duke Energy Progress 637
Duke Energy Florida 31 36
Duke Energy Ohio 80 —
OTHER COMMITMENTS AND CONTINGENCIES
General
As part of their normal business, the Duke Energy Registrants are party
to various financial guarantees, performance guarantees and other contractual
commitments to extend guarantees of credit and other assistance to various
subsidiaries, investees and other third parties. These guarantees involve
elements of performance and credit risk, which are not fully recognized on the
Consolidated Balance Sheets and have unlimited maximum potential payments.
However, the Duke Energy Registrants do not believe these guarantees will have
a material effect on their results of operations, cash flows or financial position.
Purchase Obligations
Purchased Power
Duke Energy Progress and Duke Energy Florida have ongoing purchased
power contracts, including renewable energy contracts, with other utilities,
wholesale marketers, co-generators, and qualified facilities. These purchased
power contracts generally provide for capacity and energy payments. In addition,
Duke Energy Progress and Duke Energy Florida have various contracts to secure
transmission rights.
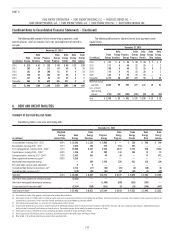
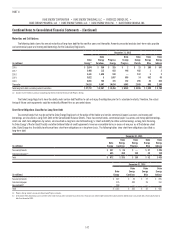
The following table presents executory purchased power contracts with terms exceeding one year, excluding contracts classified as leases.
Minimum Purchase Amount at December 31, 2015
(in millions)
Contract
Expiration 2016 2017 2018 2019 2020 Thereafter Total
Duke Energy Progress(a) 2019-2031 $ 54 $ 60 $ 61 $ 62 $ 49 $ 363 $ 649
Duke Energy Florida(b) 2021-2043 305 345 360 377 394 1,591 3,372
Duke Energy Ohio(c)(d) 2017-2018 236 195 59 — — — 490
(a) Contracts represent between 15 percent and 100 percent of net plant output.
(b) Contracts represent between 80 percent and 100 percent of net plant output.
(c) Contracts represent between 1 percent and 11 percent of net plant output.
(d) Excludes purchase power agreement with OVEC. See Note 17 for additional information.
Operating and Capital Lease Commitments
The Duke Energy Registrants lease office buildings, railcars, vehicles, computer equipment and other property and equipment with various terms and expiration
dates. Additionally, Duke Energy Progress has a capital lease related to firm gas pipeline transportation capacity. Duke Energy Progress and Duke Energy Florida have
entered into certain purchased power agreements, which are classified as leases. Consolidated capitalized lease obligations are classified as Long-Term Debt or Other
within Current Liabilities on the Consolidated Balance Sheets. Amortization of assets recorded under capital leases is included in Depreciation and amortization and
Fuel used in electric generation – regulated on the Consolidated Statements of Operations.
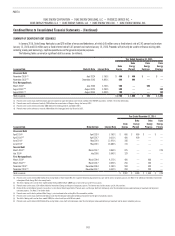
The following table presents rental expense for operating leases. These amounts are included in Operation, maintenance and other on the Consolidated
Statements of Operations.
Years Ended December 31,
(in millions) 2015 2014 2013
Duke Energy $318 $355 $321
Duke Energy Carolinas 41 41 39
Progress Energy 230 257 225
Duke Energy Progress 149 161 153
Duke Energy Florida 81 96 72
Duke Energy Ohio 13 17 14
Duke Energy Indiana 20 21 22