Duke Energy 2015 Annual Report Download - page 170
Download and view the complete annual report
Please find page 170 of the 2015 Duke Energy annual report below. You can navigate through the pages in the report by either clicking on the pages listed below, or by using the keyword search tool below to find specific information within the annual report.-
 1
1 -
2
-
3
-
4
-
5
-
6
-
7
-
8
-
9
-
10
-
11
-
12
-
13
-
14
-
15
-
16
-
17
-
18
-
19
-
20
-
21
-
22
-
23
-
24
-
25
-
26
-
27
-
28
-
29
-
30
-
31
-
32
-
33
-
34
-
35
-
36
-
37
-
38
-
39
-
40
-
41
-
42
-
43
-
44
-
45
-
46
-
47
-
48
-
49
-
50
-
51
-
52
-
53
-
54
-
55
-
56
-
57
-
58
-
59
-
60
-
61
-
62
-
63
-
64
-
65
-
66
-
67
-
68
-
69
-
70
-
71
-
72
-
73
-
74
-
75
-
76
-
77
-
78
-
79
-
80
-
81
-
82
-
83
-
84
-
85
-
86
-
87
-
88
-
89
-
90
-
91
-
92
-
93
-
94
-
95
-
96
-
97
-
98
-
99
-
100
-
101
-
102
-
103
-
104
-
105
-
106
-
107
-
108
-
109
-
110
-
111
-
112
-
113
-
114
-
115
-
116
-
117
-
118
-
119
-
120
-
121
-
122
-
123
-
124
-
125
-
126
-
127
-
128
-
129
-
130
-
131
-
132
-
133
-
134
-
135
-
136
-
137
-
138
-
139
-
140
-
141
-
142
-
143
-
144
-
145
-
146
-
147
-
148
-
149
-
150
-
151
-
152
-
153
-
154
-
155
-
156
-
157
-
158
-
159
-
 160
160 -
 161
161 -
 162
162 -
 163
163 -
 164
164 -
 165
165 -
 166
166 -
 167
167 -
 168
168 -
 169
169 -
 170
170 -
 171
171 -
 172
172 -
 173
173 -
 174
174 -
 175
175 -
 176
176 -
 177
177 -
 178
178 -
 179
179 -
 180
180 -
181
-
182
-
183
-
184
-
185
-
186
-
187
-
188
-
189
-
190
-
191
-
192
-
193
-
194
-
195
-
196
-
197
-
198
-
199
-
200
-
201
-
202
-
203
-
204
-
205
-
206
-
207
-
208
-
209
-
210
-
211
-
212
-
213
-
214
-
215
-
216
-
217
-
218
-
219
-
220
-
221
-
222
-
223
-
224
-
225
-
226
-
227
-
228
-
229
-
230
-
231
-
232
-
233
-
234
-
235
-
236
-
237
-
238
-
239
-
240
-
241
-
242
-
243
-
244
-
245
-
246
-
247
-
248
-
249
-
250
-
251
-
252
-
253
-
254
-
255
-
256
-
257
-
258
-
259
-
260
-
261
-
262
-
263
-
264
 |
 |

150
PART II
DUKE ENERGY CORPORATION • DUKE ENERGY CAROLINAS, LLC • PROGRESS ENERGY, INC. •
DUKE ENERGY PROGRESS, LLC • DUKE ENERGY FLORIDA, LLC • DUKE ENERGY OHIO, INC. • DUKE ENERGY INDIANA, INC.
Combined Notes to Consolidated Financial Statements – (Continued)
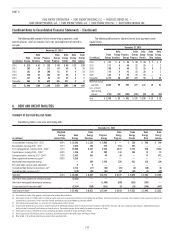
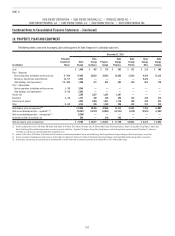
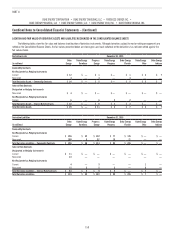
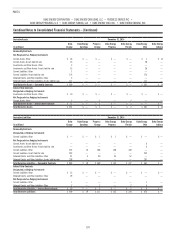
10. PROPERTY, PLANT AND EQUIPMENT
The following tables summarize the property, plant and equipment for Duke Energy and its subsidiary registrants.
December 31, 2015
(in millions)
Estimated
Useful Life
(Years)
Duke
Energy
Duke
Energy
Carolinas
Progress
Energy
Duke
Energy
Progress
Duke
Energy
Florida
Duke
Energy
Ohio
Duke
Energy
Indiana
Land $ 1,466 $ 407 $ 719 $ 392 $ 327 $ 118 $ 108
Plant – Regulated
Electric generation, distribution and transmission 8 - 100 87,593 33,623 36,422 22,888 13,534 4,429 13,118
Natural gas transmission and distribution 12 - 67 2,322 — — — — 2,322 —
Other buildings and improvements 15 - 100 1,480 477 621 294 322 204 179
Plant – Nonregulated
Electric generation, distribution and transmission 1 - 30 3,348 — — — — — —
Other buildings and improvements 5 - 50 2,363 — — — — — —
Nuclear fuel 3,194 1,827 1,367 1,367 — — —
Equipment 3 - 38 1,791 368 530 398 132 344 173
Construction in process 4,525 1,860 1,827 1,118 709 180 214
Other 2 - 60 4,744 836 1,180 856 319 153 215
Total property, plant and equipment(a)(d) 112,826 39,398 42,666 27,313 15,343 7,750 14,007
Total accumulated depreciation – regulated(b)(c)(d) (35,367) (13,521) (14,867) (10,141) (4,720) (2,507) (4,484)
Total accumulated depreciation – nonregulated(c)(d) (2,298) — — — — — —
Generation facilities to be retired, net 548 — 548 548 — — —
Total net property, plant and equipment $ 75,709 $ 25,877 $ 28,347 $ 17,720 $10,623 $ 5,243 $ 9,523
(a) Includes capitalized leases of $1,470 million, $40 million, $302 million, $144 million, $158 million, $96 million, and $39 million at Duke Energy, Duke Energy Carolinas, Progress Energy, Duke Energy Progress, Duke Energy
Florida, Duke Energy Ohio and Duke Energy Indiana, respectively, primarily within Plant – Regulated. The Progress Energy, Duke Energy Progress and Duke Energy Florida amounts are net of $85 million, $7 million and
$78 million, respectively, of accumulated amortization of capitalized leases.
(b) Includes $1,621 million, $976 million, $645 million and $645 million of accumulated amortization of nuclear fuel at Duke Energy, Duke Energy Carolinas, Progress Energy and Duke Energy Progress, respectively.
(c) Includes accumulated amortization of capitalized leases of $58 million, $11 million, $27 million and $7 million at Duke Energy, Duke Energy Carolinas, Duke Energy Ohio and Duke Energy Indiana, respectively.
(d) Includes gross property, plant and equipment cost of consolidated VIEs of $2,033 million and accumulated depreciation of consolidated VIEs of $327 million at Duke Energy.