Duke Energy 2015 Annual Report Download - page 18
Download and view the complete annual report
Please find page 18 of the 2015 Duke Energy annual report below. You can navigate through the pages in the report by either clicking on the pages listed below, or by using the keyword search tool below to find specific information within the annual report.-
 1
1 -
2
-
3
-
4
-
5
-
6
-
7
-
 8
8 -
 9
9 -
 10
10 -
 11
11 -
 12
12 -
 13
13 -
 14
14 -
 15
15 -
 16
16 -
 17
17 -
 18
18 -
 19
19 -
 20
20 -
 21
21 -
 22
22 -
 23
23 -
 24
24 -
 25
25 -
 26
26 -
 27
27 -
 28
28 -
29
-
30
-
31
-
32
-
33
-
34
-
35
-
36
-
37
-
38
-
39
-
40
-
41
-
42
-
43
-
44
-
45
-
46
-
47
-
48
-
49
-
50
-
51
-
52
-
53
-
54
-
55
-
56
-
57
-
58
-
59
-
60
-
61
-
62
-
63
-
64
-
65
-
66
-
67
-
68
-
69
-
70
-
71
-
72
-
73
-
74
-
75
-
76
-
77
-
78
-
79
-
80
-
81
-
82
-
83
-
84
-
85
-
86
-
87
-
88
-
89
-
90
-
91
-
92
-
93
-
94
-
95
-
96
-
97
-
98
-
99
-
100
-
101
-
102
-
103
-
104
-
105
-
106
-
107
-
108
-
109
-
110
-
111
-
112
-
113
-
114
-
115
-
116
-
117
-
118
-
119
-
120
-
121
-
122
-
123
-
124
-
125
-
126
-
127
-
128
-
129
-
130
-
131
-
132
-
133
-
134
-
135
-
136
-
137
-
138
-
139
-
140
-
141
-
142
-
143
-
144
-
145
-
146
-
147
-
148
-
149
-
150
-
151
-
152
-
153
-
154
-
155
-
156
-
157
-
158
-
159
-
160
-
161
-
162
-
163
-
164
-
165
-
166
-
167
-
168
-
169
-
170
-
171
-
172
-
173
-
174
-
175
-
176
-
177
-
178
-
179
-
180
-
181
-
182
-
183
-
184
-
185
-
186
-
187
-
188
-
189
-
190
-
191
-
192
-
193
-
194
-
195
-
196
-
197
-
198
-
199
-
200
-
201
-
202
-
203
-
204
-
205
-
206
-
207
-
208
-
209
-
210
-
211
-
212
-
213
-
214
-
215
-
216
-
217
-
218
-
219
-
220
-
221
-
222
-
223
-
224
-
225
-
226
-
227
-
228
-
229
-
230
-
231
-
232
-
233
-
234
-
235
-
236
-
237
-
238
-
239
-
240
-
241
-
242
-
243
-
244
-
245
-
246
-
247
-
248
-
249
-
250
-
251
-
252
-
253
-
254
-
255
-
256
-
257
-
258
-
259
-
260
-
261
-
262
-
263
-
264
 |
 |

earnings and adjusted diluted EPS prior to the sale of the Disposal Group.
Additionally, as a result of completing the sale of the Disposal Group during the
second quarter of 2015, state income tax expense increased as state income
tax apportionments changed. The additional tax expense was recognized in
Continuing Operations on a GAAP basis. This impact to state income taxes has
been excluded from the Commercial Portfolio segment for adjusted diluted EPS
purposes as management believes these impacts are incidental to the sale of
the Disposal Group. Derivative contracts are used in Duke Energy’s hedging
of a portion of the economic value of its generation assets in the Commercial
Portfolio segment. The mark-to-market impact of derivative contracts is
recognized in GAAP earnings immediately and, if associated with the Disposal
Group, classified as discontinued operations, as such derivative contracts do
not qualify for hedge accounting or regulatory treatment. The economic value
of generation assets is subject to fluctuations in fair value due to market
price volatility of input and output commodities (e.g., coal, electricity, natural
gas). Economic hedging involves both purchases and sales of those input and
output commodities related to generation assets. Operations of the generation
assets are accounted for under the accrual method. Management believes
excluding impacts of mark-to-market changes of the derivative contracts from
adjusted earnings until settlement better matches the financial impacts of
the derivative contract with the portion of economic value of the underlying
hedged asset. Management believes the presentation of adjusted earnings and
adjusted diluted EPS provides useful information to investors, as it provides
them an additional relevant comparison of Duke Energy’s performance across
periods. Management uses these non-GAAP financial measures for planning
and forecasting and for reporting results to the Duke Energy Board of Directors,
employees, shareholders, analysts and investors concerning Duke Energy’s
financial performance. Adjusted diluted EPS is also used as a basis for
employee incentive bonuses. The most directly comparable GAAP measures for
adjusted earnings and adjusted diluted EPS are Net Income Attributable to Duke
Energy Corporation and Diluted EPS Attributable to Duke Energy Corporation
common shareholders, which include the dollar and per share impact of special
items, mark-to-market impacts of economic hedges in the Commercial Portfolio
segment and discontinued operations.
Duke Energy’s adjusted earnings and adjusted diluted EPS may not be
comparable to similarly titled measures of another company because other
entities may not calculate the measures in the same manner.
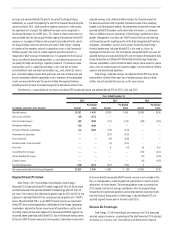
The following is a reconciliation of net income and diluted EPS to adjusted income and adjusted diluted EPS for 2015, 2014 and 2013:
Years Ended December 31,
2015 2014 2013
(in millions, except per share amounts) Amount
Per Diluted
Share Amount
Per Diluted
Share Amount
Per Diluted
Share
Adjusted earnings $3,152 $ 4.54 $3,218 $ 4.55 $3,080 $4.36
Cost savings initiatives (88) (0.13) — — — —
Costs to achieve mergers (60) (0.09) (127) (0.18) (184) (0.26)
Edwardsport settlement (58) (0.08) — — — —
Ash basin settlement and penalties (11) (0.02) (102) (0.14) — —
International tax adjustment — — (373) (0.53) — —
Asset impairment — — (59) (0.08) — —
Economic hedges (mark-to-market) — — (6) (0.01) — —
Asset sales — — 9 0.01 50 0.07
Crystal River Unit 3 charges — — — — (215) (0.31)
Nuclear development charges — — — — (57) (0.08)
Litigation reserve — — — — (14) (0.02)
Discontinued operations (119) (0.17) (677) (0.96) 5 —
Net income attributable to Duke Energy Corporation $2,816 $ 4.05 $1,883 $ 2.66 $2,665 $3.76
Adjusted Diluted EPS Outlook
Duke Energy’s 2015 Annual Report also references Duke Energy’s
forecasted 2015 adjusted diluted EPS outlook range of $4.55 to $4.65 per share
and the forecasted 2016 adjusted diluted EPS outlook range of $4.50 to $4.70
per share. The materials also reference the growth range for 2016 to 2020 of 4 to
6 percent in adjusted diluted EPS (on a compound annual growth rate (“CAGR”)
basis). Adjusted diluted EPS is a non-GAAP financial measure as it represents
diluted EPS from continuing operations attributable to Duke Energy Corporation
shareholders, adjusted for the per share impact of special items and the mark-
to-market impacts of economic hedges in the Commercial Portfolio segment (as
discussed above under Adjusted Diluted EPS). Due to the forward-looking nature
of this non-GAAP financial measure for future periods, information to reconcile it
to the most directly comparable GAAP financial measure is not available at this
time, as management is unable to project all special items or mark-to-market
adjustments for future periods. The earnings guidance range assumptions for
2015 include a half year of earnings contributions from the Disposal Group.
Irrespective of discontinued operations accounting treatment, operating results
from the Disposal Group remain in Duke Energy’s adjusted diluted EPS and
adjusted segment income prior to the sale in April 2015.
Business Mix Percentages
Duke Energy’s 2015 Annual Report also references the 2016 forecasted
adjusted segment income as a percentage of the total forecasted 2016 adjusted
net income (i.e., business mix). The materials also reference the historical