Duke Energy 2015 Annual Report Download - page 67
Download and view the complete annual report
Please find page 67 of the 2015 Duke Energy annual report below. You can navigate through the pages in the report by either clicking on the pages listed below, or by using the keyword search tool below to find specific information within the annual report.-
 1
1 -
2
-
3
-
4
-
5
-
6
-
7
-
8
-
9
-
10
-
11
-
12
-
13
-
14
-
15
-
16
-
17
-
18
-
19
-
20
-
21
-
22
-
23
-
24
-
25
-
26
-
27
-
28
-
29
-
30
-
31
-
32
-
33
-
34
-
35
-
36
-
37
-
38
-
39
-
40
-
41
-
42
-
43
-
44
-
45
-
46
-
47
-
48
-
49
-
50
-
51
-
52
-
53
-
54
-
55
-
56
-
 57
57 -
 58
58 -
 59
59 -
 60
60 -
 61
61 -
 62
62 -
 63
63 -
 64
64 -
 65
65 -
 66
66 -
 67
67 -
 68
68 -
 69
69 -
 70
70 -
 71
71 -
 72
72 -
 73
73 -
 74
74 -
 75
75 -
 76
76 -
 77
77 -
78
-
79
-
80
-
81
-
82
-
83
-
84
-
85
-
86
-
87
-
88
-
89
-
90
-
91
-
92
-
93
-
94
-
95
-
96
-
97
-
98
-
99
-
100
-
101
-
102
-
103
-
104
-
105
-
106
-
107
-
108
-
109
-
110
-
111
-
112
-
113
-
114
-
115
-
116
-
117
-
118
-
119
-
120
-
121
-
122
-
123
-
124
-
125
-
126
-
127
-
128
-
129
-
130
-
131
-
132
-
133
-
134
-
135
-
136
-
137
-
138
-
139
-
140
-
141
-
142
-
143
-
144
-
145
-
146
-
147
-
148
-
149
-
150
-
151
-
152
-
153
-
154
-
155
-
156
-
157
-
158
-
159
-
160
-
161
-
162
-
163
-
164
-
165
-
166
-
167
-
168
-
169
-
170
-
171
-
172
-
173
-
174
-
175
-
176
-
177
-
178
-
179
-
180
-
181
-
182
-
183
-
184
-
185
-
186
-
187
-
188
-
189
-
190
-
191
-
192
-
193
-
194
-
195
-
196
-
197
-
198
-
199
-
200
-
201
-
202
-
203
-
204
-
205
-
206
-
207
-
208
-
209
-
210
-
211
-
212
-
213
-
214
-
215
-
216
-
217
-
218
-
219
-
220
-
221
-
222
-
223
-
224
-
225
-
226
-
227
-
228
-
229
-
230
-
231
-
232
-
233
-
234
-
235
-
236
-
237
-
238
-
239
-
240
-
241
-
242
-
243
-
244
-
245
-
246
-
247
-
248
-
249
-
250
-
251
-
252
-
253
-
254
-
255
-
256
-
257
-
258
-
259
-
260
-
261
-
262
-
263
-
264
 |
 |

47
PART II
DUKE ENERGY OHIO
Introduction
Management’s Discussion and Analysis should be read in conjunction
with the accompanying Consolidated Financial Statements and Notes for the
years ended December 31, 2015, 2014 and 2013.
Basis of Presentation
The results of operations and variance discussion for Duke Energy Ohio is
presented in a reduced disclosure format in accordance with General Instruction
(I)(2)(a) of Form 10-K.
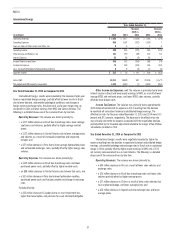
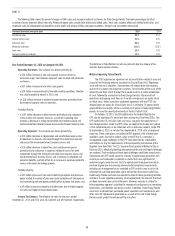
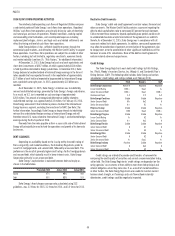
Results of Operations
Years Ended December 31,
(in millions) 2015 2014 Variance
Operating Revenues $ 1,905 $ 1,913 $ (8)
Operating Expenses 1,610 1,727 (117)
Gains on Sales of Other Assets and Other, net 81 7
Operating Income 303 187 116
Other Income and Expense, net 610 (4)
Interest Expense 79 86 (7)
Income from Continuing Operations Before Income Taxes 230 111 119
Income Tax Expense from Continuing Operations 81 43 38
Income from Continuing Operations 149 68 81
Income (Loss) from Discontinued Operations, net of tax 23 (563) 586
Net Income (Loss) $ 172 $ (495) $ 667
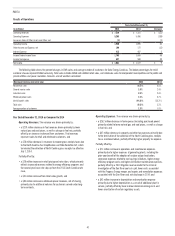
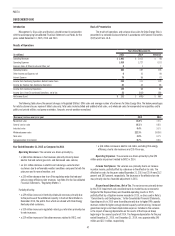
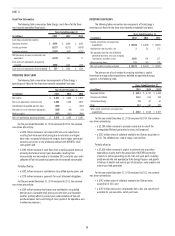
The following table shows the percent changes in Regulated Utilities’ GWh sales and average number of customers for Duke Energy Ohio. The below percentages
for retail customer classes represent billed sales only. Total sales includes billed and unbilled retail sales, and wholesale sales to incorporated municipalities and to
public and private utilities and power marketers. Amounts are not weather normalized.
(Decrease) increase over prior year 2015 2014
Residential sales (2.2)% 1.3%
General service sales (0.1)% 0.8%
Industrial sales 0.4% 3.3%
Wholesale power sales 222.3% (24.9)%
Total sales 2.8% 0.7%
Average number of customers 0.7% 0.6%
Year Ended December 31, 2015 as Compared to 2014
Operating Revenues. The variance was driven primarily by:
• a $66 million decrease in fuel revenues primarily driven by lower
electric fuel and natural gas costs and decreased sales volume;
• an $11 million decrease in electric and natural gas sales to retail
customers due to unfavorable weather conditions compared to both the
prior year and to normal weather; and
• a $10 million decrease due to an Ohio regulatory order that reduced
certain energy efficiency rider revenues (see Note 4 to the Consolidated
Financial Statements, “Regulatory Matters”).
Partially offset by:
• a $29 million increase in Kentucky wholesale revenues primarily due
to the purchase of the additional capacity in the East Bend Station in
December 2014, the profits from which are shared with Duke Energy
Kentucky retail customers;
• a $19 million increase in regulated natural gas rate riders primarily due
to rate increases;
• a $19 million increase in Ohio other revenues related to OVEC; and
• a $16 million increase in electric rate riders, excluding Ohio energy
efficiency, due to rate increases and 2014 true-ups.
Operating Expenses. The variance was driven primarily by the $94
million pretax impairment related to OVEC in 2014.
Income Tax Expense. The variance was primarily due to an increase
in pretax income, partially offset by a decrease in the effective tax rate. The
effective tax rates for the years ended December 31, 2015 and 2014 were 35.2
percent and 38.9 percent, respectively. The decrease in the effective tax rate
was primarily due to a favorable adjustment in 2015.
Discontinued Operations, Net of Tax. The variance was primarily driven
by the 2014 impairment and unrealized mark-to-market losses on economic
hedges for the Disposal Group and favorable operating results in 2015,
partially offset by a litigation reserve recorded in 2015, as discussed in Note 5,
“Commitments and Contingencies,” to the Consolidated Financial Statements.
Operating results in 2015 were favorable primarily due to higher PJM capacity
revenues related to higher average cleared capacity auction pricing, increased
generation margins and lower depreciation expense. Included in the variance
is the impact of ceasing depreciation on the assets of the Disposal Group
beginning in the second quarter of 2014. The foregone depreciation for the year
ended December 31, 2015, and December 31, 2014, was approximately $40
million and $121 million, respectively.